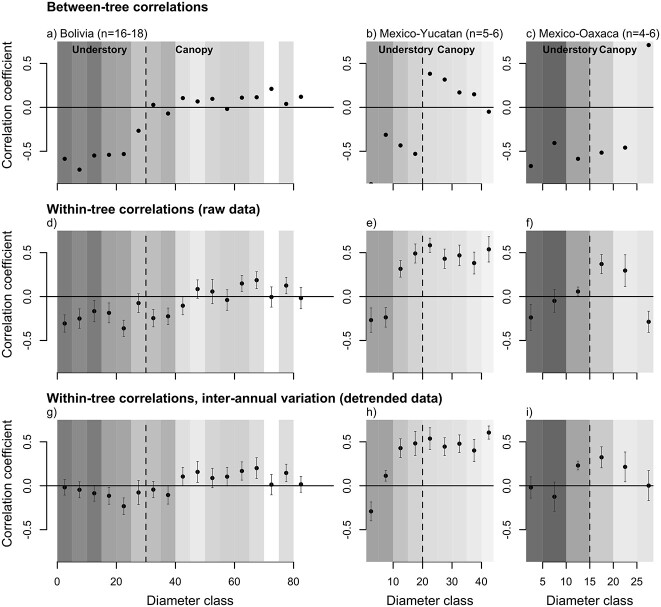
Figure 7.
Correlation coefficients between growth and discrimination by diameter class for three sites between trees (cf., Figure 6) and within-trees using detrended data. Vertical broken lines indicate the approximate size at which trees reach the canopy for the three sites, respectively, at 30, 20 and 15 cm in diameter for Bolivia, Yucatan and Oaxaca. The gray scale of the background corresponds to the average crown exposure index, with darker colors representing lower light levels. Error bars in panels (d–i) indicate the standard error of the variation between trees in correlation coefficients (i.e., standard deviation/sqrt(n)). Sample sizes refer to the number of trees included in the correlations for each size class.

