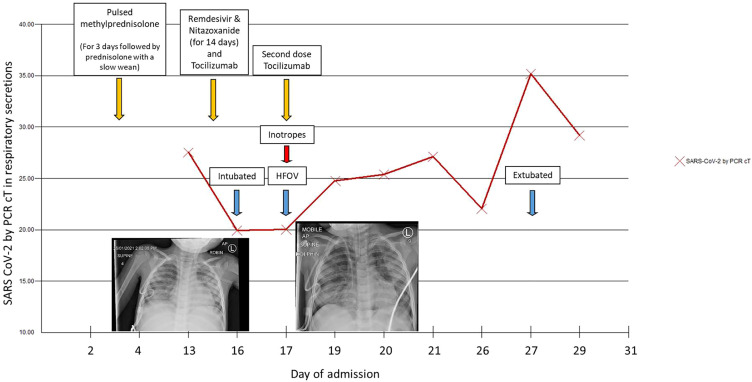
Figure 1.
SARS CoV-2 cycle threshold (cT) over time and chest X-rays from Day 13 (left) showing widespread patchy airspace opacification and Day 16 (right) post-intubation showing a large volume pneumomediastinum, with “continuous diaphragm” sign and gas extending superiorly into the neck and inferiorly below the diaphragm.

