
FIGURE 6. Comparison of longitudinal Ab responses in severe/critical and mild/moderate SARS-CoV-2 patients over 150 d.
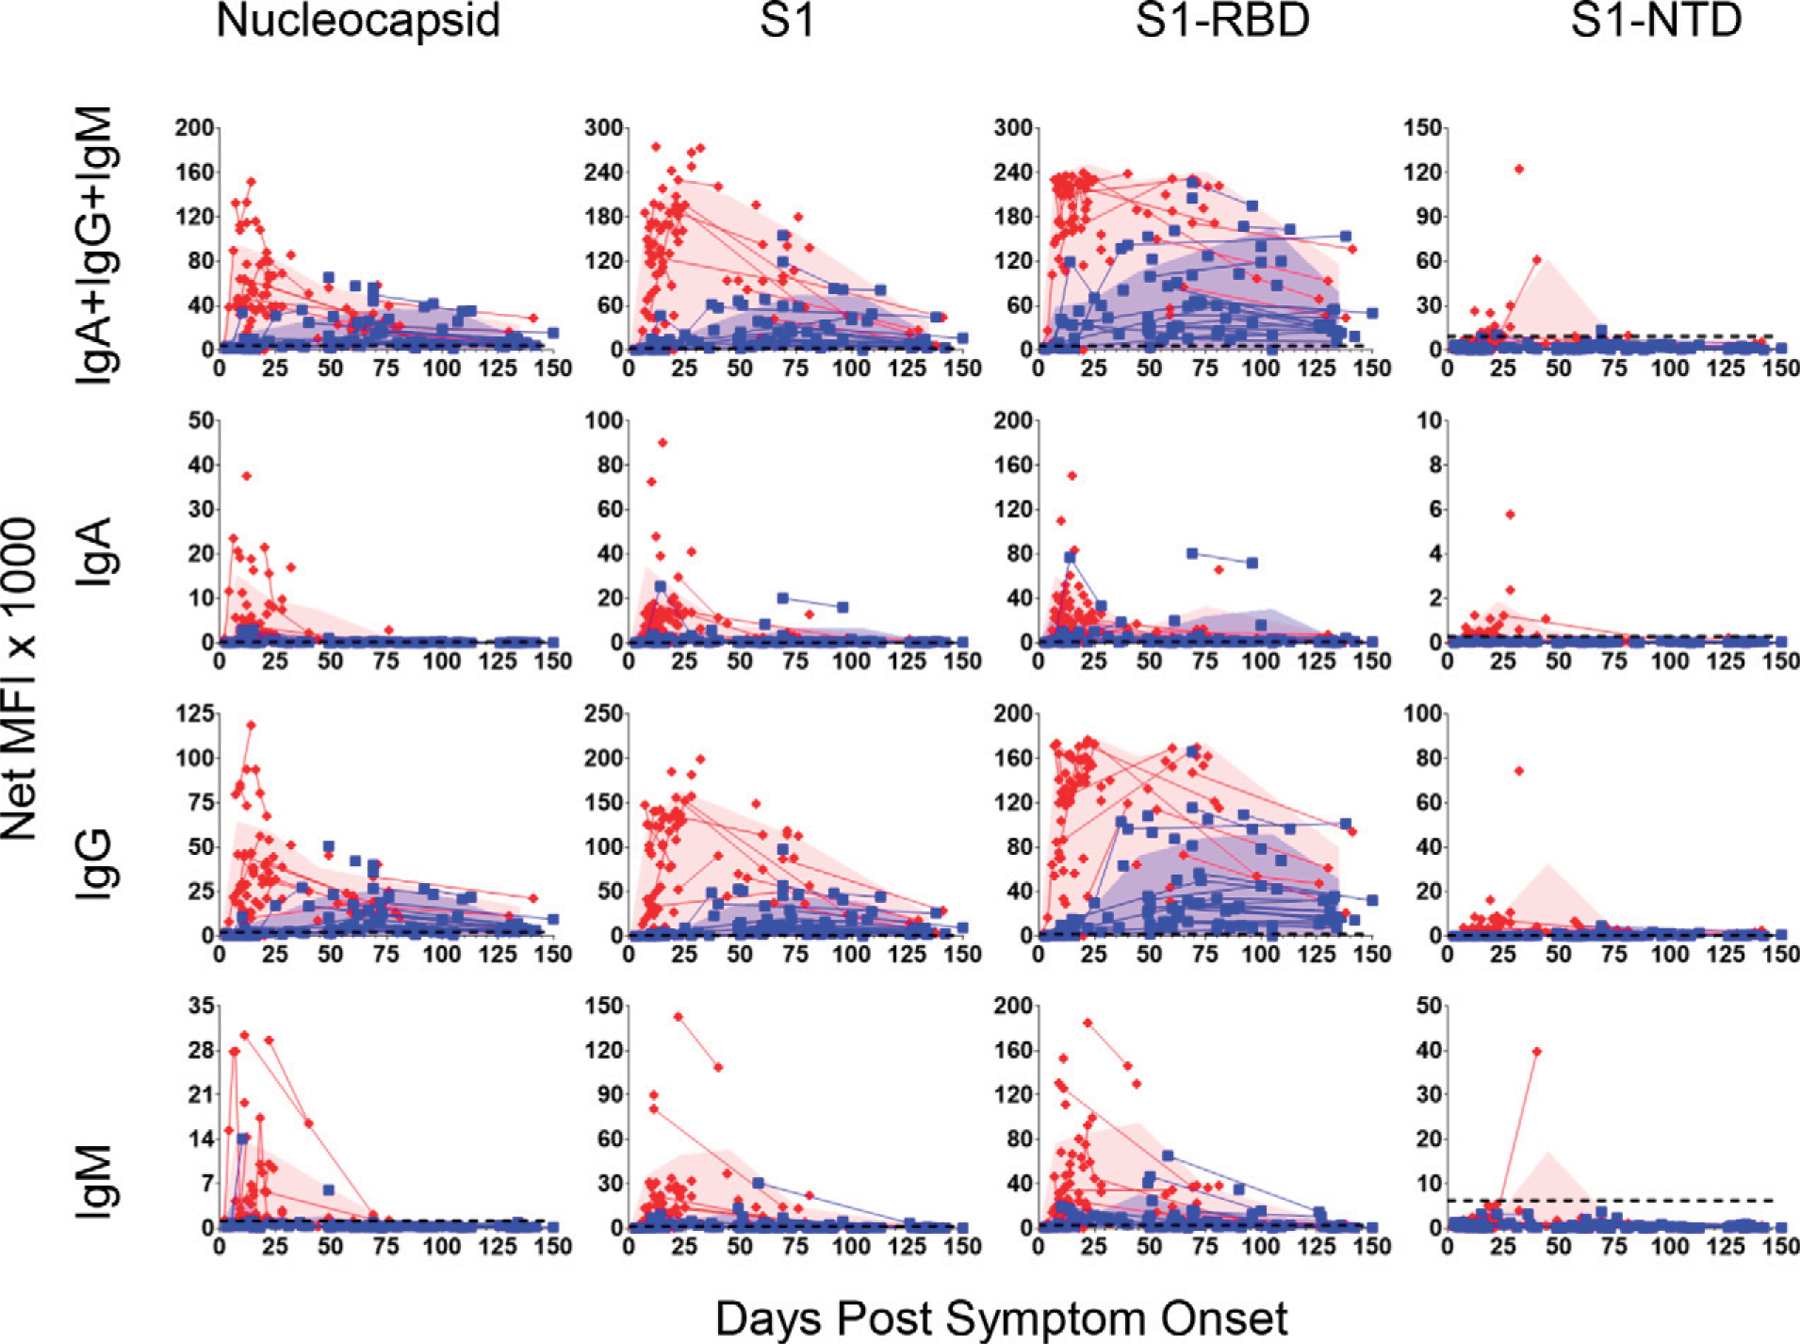
Serum samples were collected from patients with mild/moderate (83 samples from 55 patients; blue squares) or severe/critical (82 samples from 55 patients; red diamonds) SARS-CoV-2 infections from 2–150 DPSO. Lines connect multiple samples drawn from the same patient. Shaded blue and red areas represent the mean plus SDs of mild/moderate or severe/critical patient groups, respectively, during 0–15, 16–30, 31–60, 61–90, 91–120, and 121–150 DPSO and plotted at the midpoint of each time interval. Number of samples used at each time interval: mild/moderate, n = 12, 6, 20, 21, 11, and 13; and severe/critical, n = 34, 23, 10, 9, 0, and 5. Data point was skipped for the severe/critical group at the 91–120 DPSO interval because only one sample was drawn during that timeframe. Dashed lines indicate the C0 (from Fig. 1).