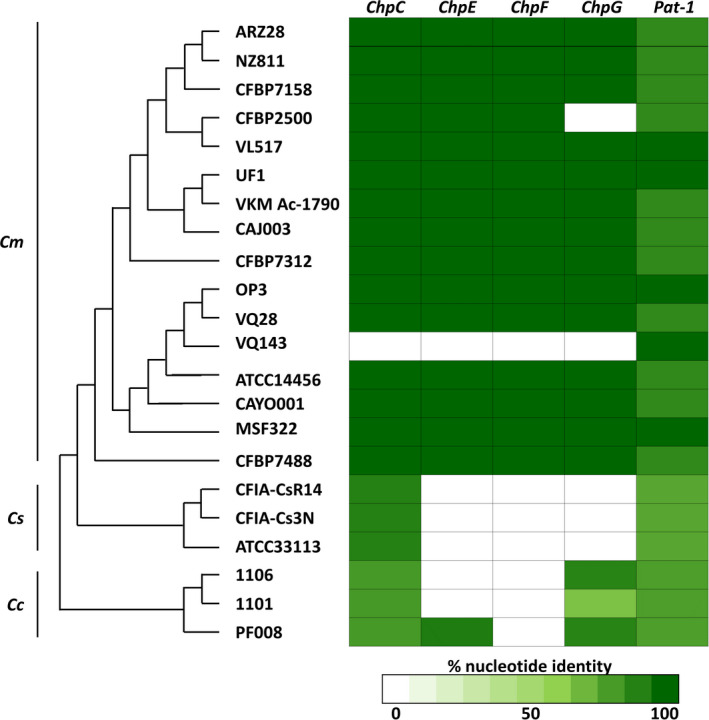
FIGURE 7.

Distribution of Pat‐1 homologs among Clavibacter spp. Figure states the distribution of Pat‐1 homologs of Clavibacter michiganensis (Cm) NCPPB 382 [ChpC (CMM_0052), ChpE (CMM_0039), ChpF (CMM_0053), ChpG (CMM_0059), and Pat‐1 (pCM2_0054)] within NCBI genome deposits of Cm, C. sepedonicus (Cs), and C. capsici (Cc). Left, multilocus sequence typing phylogenetic analysis conducted by AutoMLST (https://automlst.ziemertlab.com/analyze); right, percentage nucleotide identity according to NCBI blastn suite (https://blast.ncbi.nlm.nih.gov/Blast.cgi, cut off set at E‐value of e−6) of the five Pat‐1 homologs in the Cm, Cs, and Cc genomes marked by green colour intensity according to the scale located at the bottom of the figure
