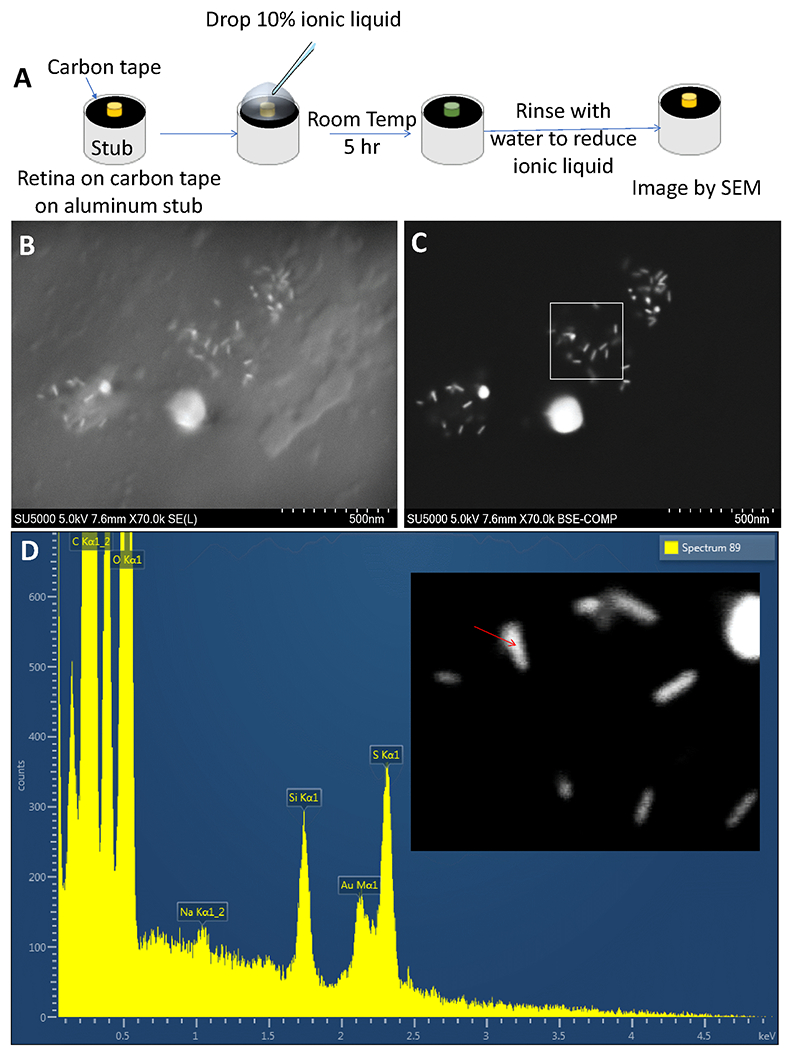
Fig. 6. Identification and distribution of fGNRs in-vivo visualized by scanning electron microscopy imaging.

(A) Schematics illustration of the steps involved for imaging the NOD eye cup. (B) Scanning electron microscope image revealing the surface morphology and presence of fGNRs on the retina surface. (C) Back-scattered electron (BSE) image of fGNR-injected mouse eye showing distribution of fGNRs. (D) Compositional information of an attached gold nanorod (marked by red arrow) obtained via Energy Dispersive X-ray analysis.
