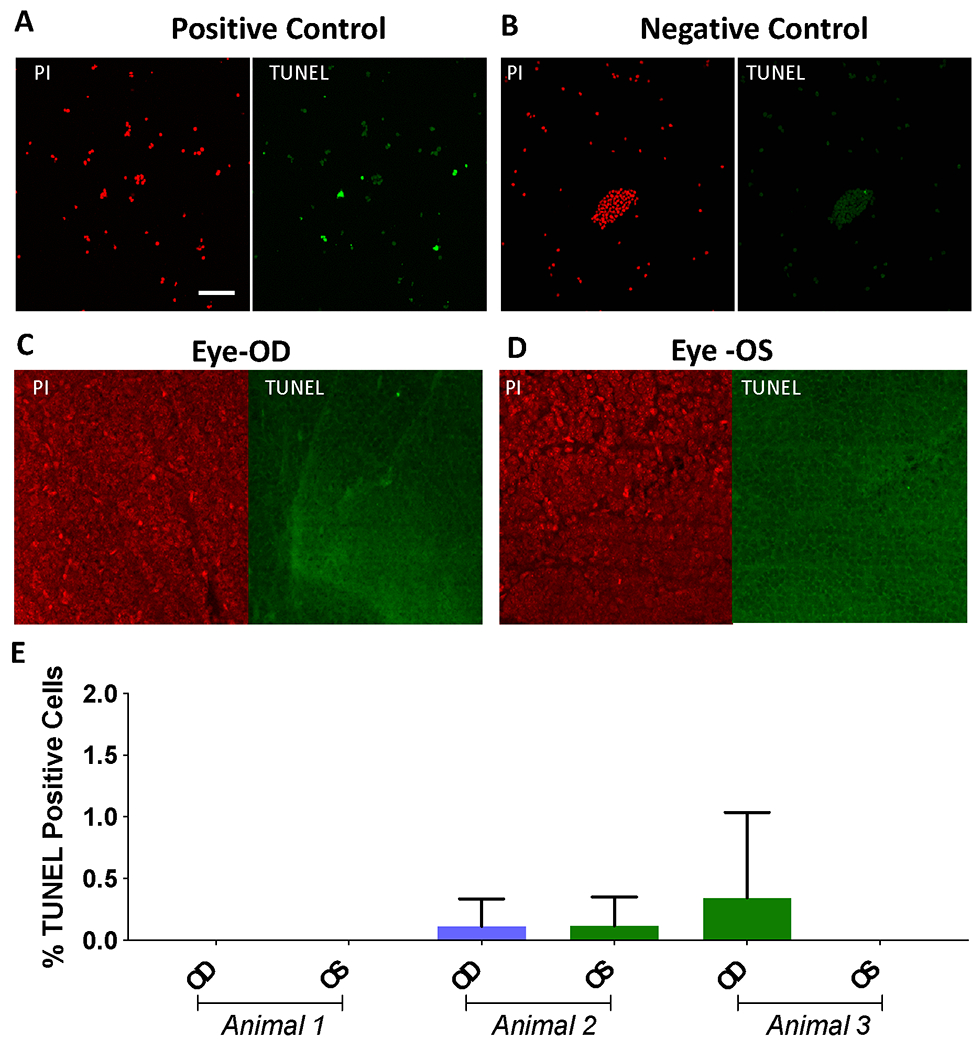
Fig. 7. TUNEL assay to evaluate apoptosis of retinal cells after in-vivo optical delivery of MCO-II.

Confocal fluorescence image of (A) TUNEL positive cells (in green channel, Propidium Iodide in red channel showing cell nuclei), and (B) TUNEL-Negative control cells. Representative fluorescence images of rd10 mouse retina after 1 wk of intravitreal injection of fGNRs and MCO-II plasmids, (C) with laser delivery in OD eye and (D) without laser irradiation in OS eye. The laser dose was 1800 mJ/mm2 (30 mW, 60 sec, 1 mm2 area). Scale: 50 μm. Apoptotic cells are marked as green dots. (E) Quantitative comparison of TUNEL +ve cells. N= 3 animals. Av± SD.
