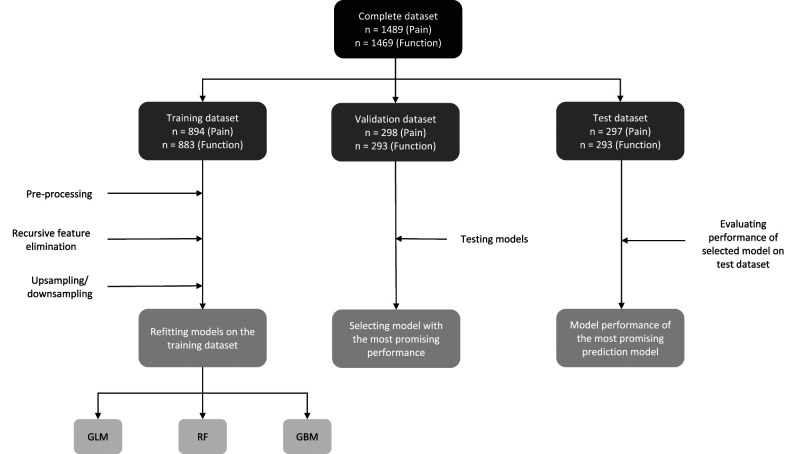
Fig. 2.
This flow diagram shows the selection of prediction models. The complete dataset was split into training (60%), validation (20%), and test (20%) datasets. The training set was used for feature elimination, resampling, and training of the prediction models. The best-performing models of each algorithm were evaluated in the validation dataset. The performance of the model with the best AUC and calibration in the validation dataset was further evaluated in the test dataset; GLM = generalized linear model; RF = random forest; GBM = gradient boosting machine; AUC = area under the curve.

