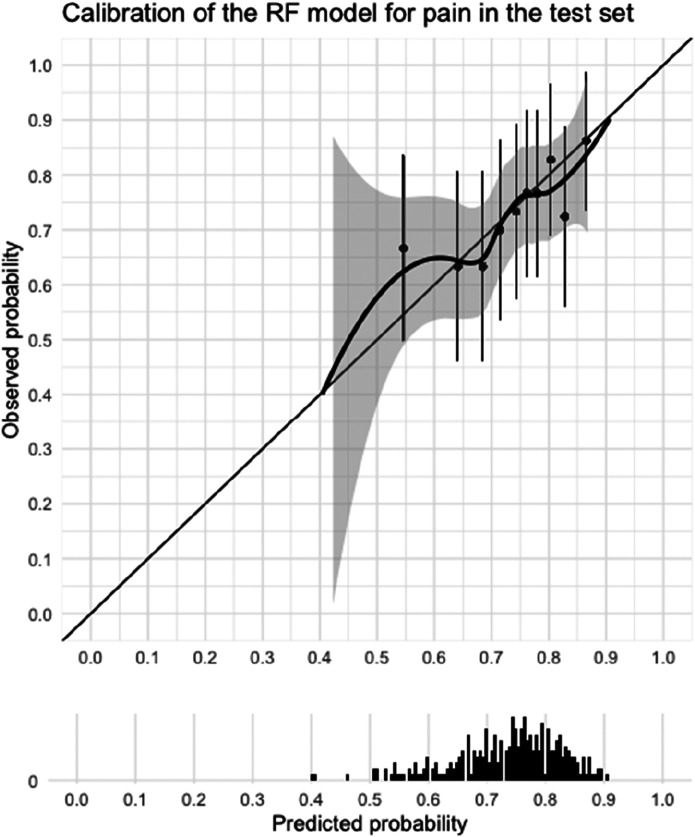
Fig. 3.
This graph shows the calibration curve of the selected prediction model (random forest) for pain in the test dataset and a histogram of the distribution of the predicted probabilities of improvement. Calibration refers to agreement between the predicted probabilities and observed probabilities. In other words, if 10 people had a probability of improvement of 0.6, did six people actually improve? The model performs well on calibration when the calibration curve lies close to the bisector. Calibration for our pain model was insufficient because of the wide confidence interval and because the curve does not cover the lower probability range.

