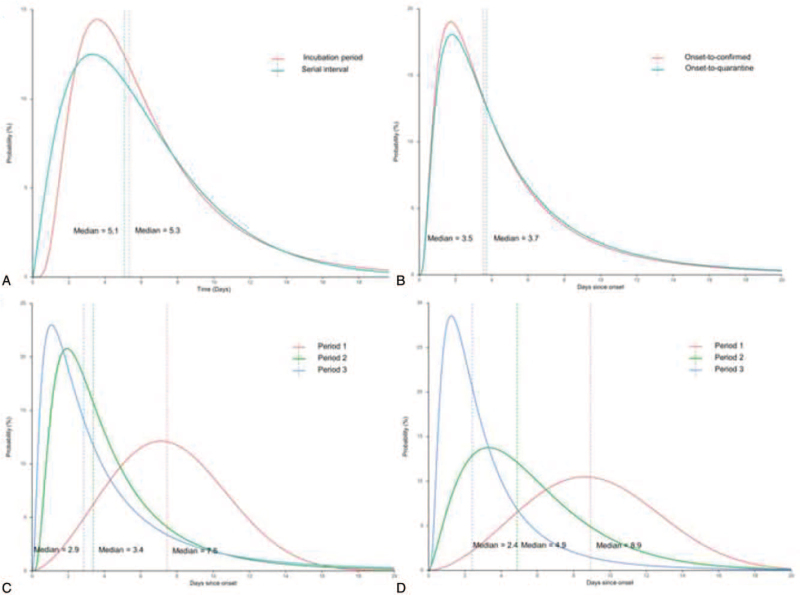
Figure 2.
Key time-to-event distributions of COVID-19 cases in Guangzhou, China, 2020. The vertical dashed lines represent the medians of the best-fitted distribution. (A) Comparison between the best-fitting distributions of serial interval and incubation period distribution; (B) comparison between the best-fitting distributions of the onset-to-quarantine and of the onset-to-confirmed for whole period; (C) comparison between the best-fitting distributions of the onset-to-quarantine for 3 periods; (D) comparison between the best-fitting distributions of the onset-to-confirmed for 3 periods.

