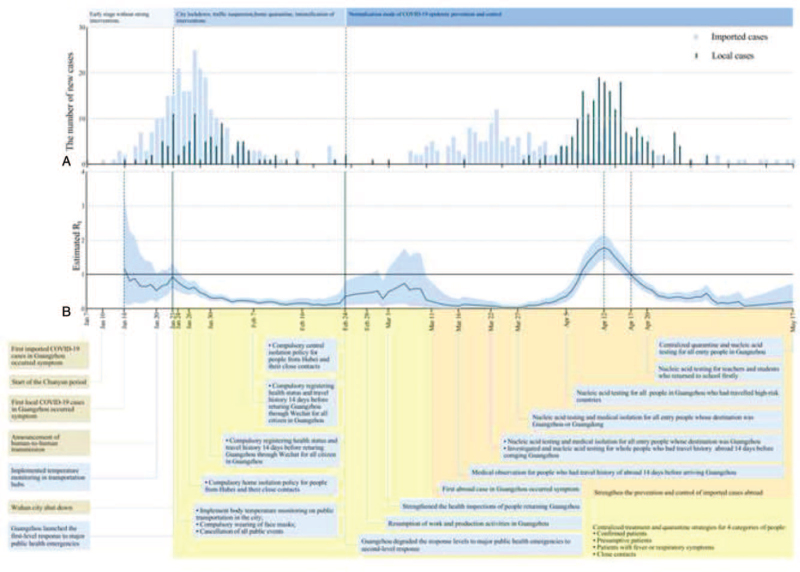
Figure 3.
The effective reproduction number estimates based on laboratory-confirmed COVID-19 cases and public health control measures in Guangzhou. (A) The time distribution of imported and local cases by date of onset; (B) results were shown since January 14, calculated for the whole period (from January 14 to May 17) over 7-day moving average. The black horizontal line indicated Rt = 1, below which sustained transmission is unlikely so long as public health control measures were sustained, indicating that the outbreak is under control. The 95% credible intervals (CI) were presented as light bule shading. Daily estimates of Rt with 95% CrIs were shown in Supplementary Table 6, Supplemental Digital Content.

