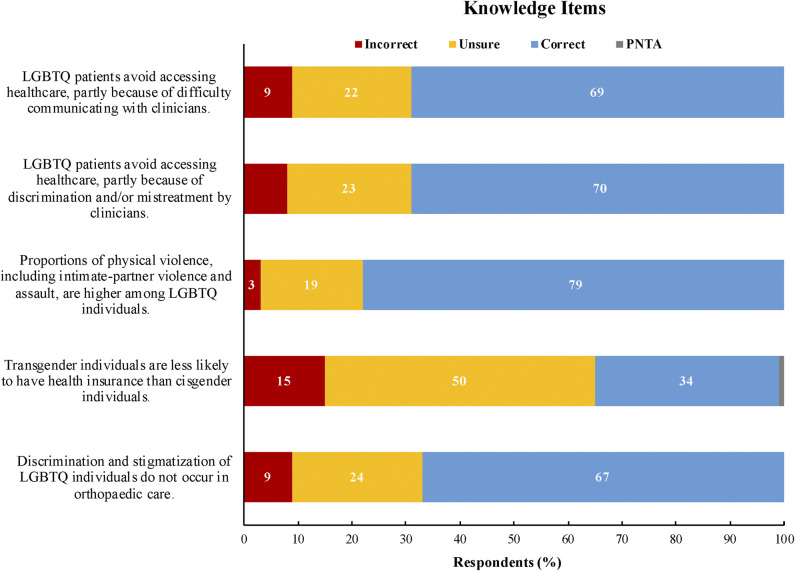
Fig. 3.
This graph shows the distribution of responses to the knowledge items. Data labels were removed for values less than 3%. Responses for “strongly agree” and “agree,” and “strongly disagree” and “disagree” were assigned to “correct” and “incorrect” according to existing studies on this topic [11, 18, 23, 44]; LGBTQ = lesbian, gay, bisexual, transgender, and queer; PNTA = prefer not to answer or missing. A color image accompanies the online version of this article.

