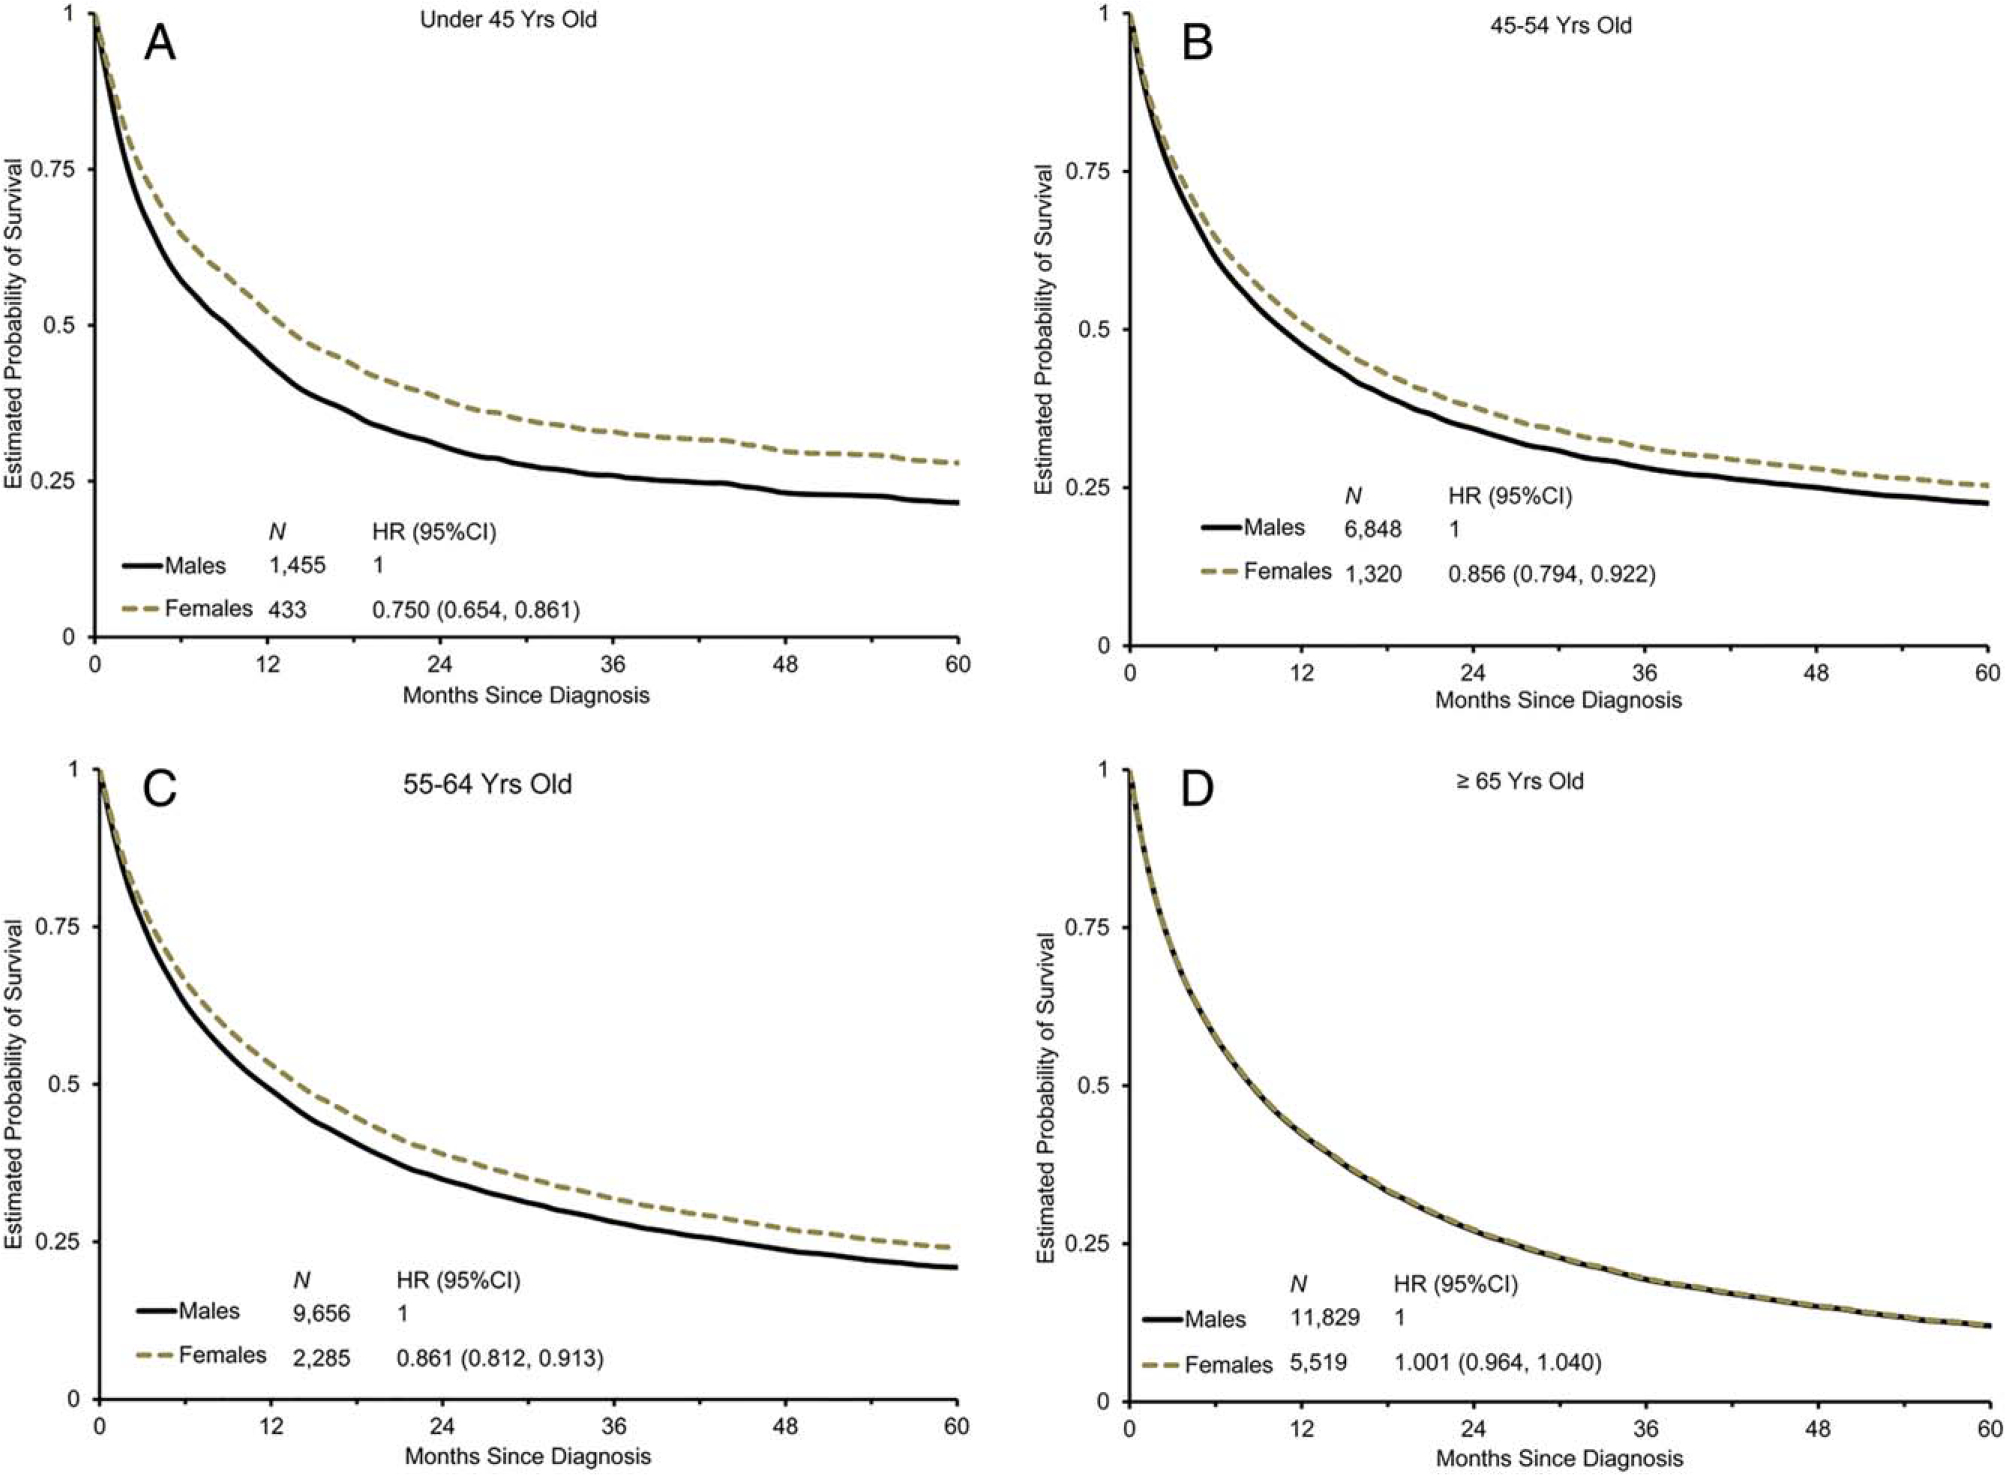
Figure 3.

Overall survival is shown by sex and age. Survival probability curves are shown in patients aged (A) 18 to 44 years, (B) 45 to 54 years, (C) 55 to 64 years, and (D) ≥65 years. Men were used as the reference group for hazard ratios (HRs), which were adjusted for race, stage of disease, marital status, birthplace, tumor size, tumor grade, initial surgical procedure, initial radiation, and year of diagnosis and stratified by the Surveillance, Epidemiology, and End Results (SEER) registry. 95% CI indicates 95% confidence interval.
