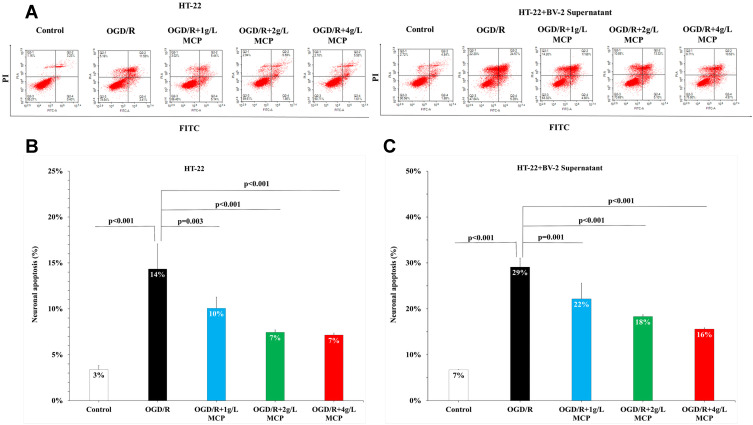
Figure 5.
MCP attenuated neuronal cell apoptosis in OGD/R model. (A) Neuronal cell (HT-22) apoptosis after OGD/R was assessed by flow cytometry. (B) Representative flow cytometry images of neuronal cell (HT-22) apoptosis. (C) Representative flow cytometry images of neuronal cell (HT-22) apoptosis, when co-cultured with supernatant of BV-2 cells. MCP indicates modified citrus pectin, OGD/R, oxygen-glucose deprivation/reperfusion. Data are mean ± standard deviation, and n=5 per group.

