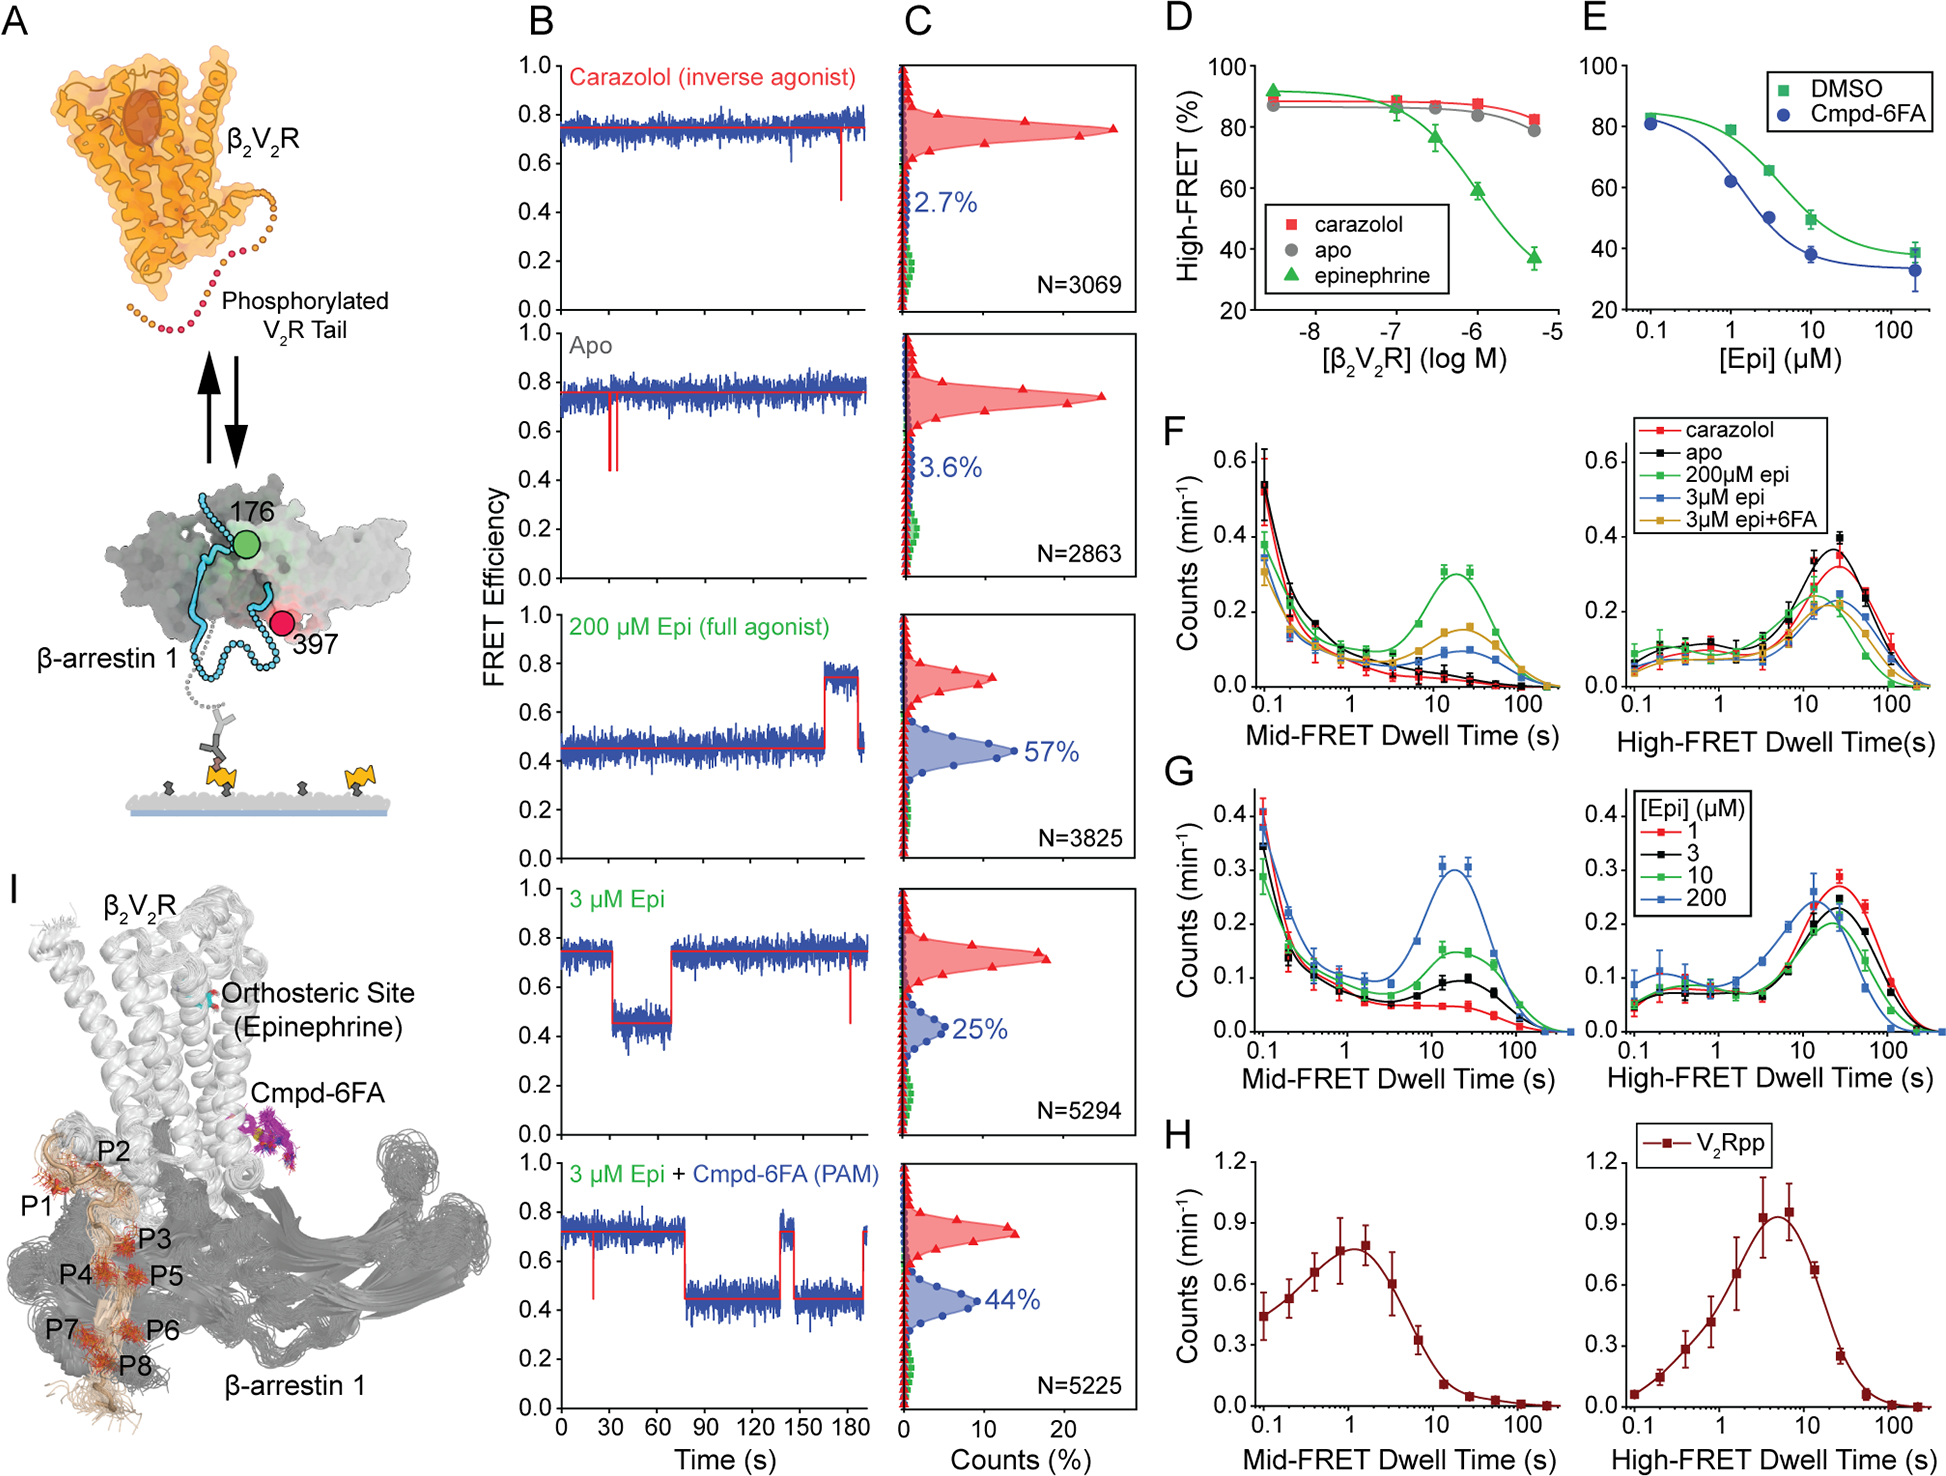
Figure 5. Activation of β-arrestin1 by phosphorylated, agonist-bound receptor.

A, Schematic of the experiment showing βarr1 tethered to an imaging surface interacting with pβ2V2R free in solution and bound to ligands of varying efficacy. B, Representative FRET (blue) and state assignment (red) traces and C, population FRET histograms from smFRET imaging of βarr tail sensor conducted in the presence of 1 μM pβ2V2R and 10 μM carazolol, no ligands, 200 μM epi, 3 μM epi, or 3 μM epi with 10 μM Cmpd-6FA, respectively. D, High-FRET inactive state occupancy as a function of pβ2V2R concentration in the presence of saturating concentrations of the indicated receptor-binding ligand (symbols) fit to dose response functions (lines) with a Hill slope of 1 and EC50 values of 44 (carazolol; red), 30 (apo; gray), and 1.0 μM (epi; green). E, High-FRET inactive state occupancy from experiments conducted in the presence of 1 μM pβ2V2R and the indicated concentration of epinephrine in the absence (blue) and presence (green) of 10 μM Cmpd-6FA fit to dose response functions with Hill slope of 1.0 and EC50 values of 3.7 and 1.0 μM, respectively. F-H, Histograms of dwell times in the mid-FRET active (left) and high-FRET inactive (right) states: F, from experiments corresponding to panels B-C, G, from experiments with 1 μM pβ2V2R and the indicated concentrations of epinephrine, and H, from experiments with 1 μM V2Rpp duplicated from Figure 2 for comparison. I, Representative MD frames of the simulated pβ2V2R-βarr complex model bound to epinephrine (cyan) and Cmpd-6FA (magenta) showing the positions and dynamics of P1 to P8 in V2Rpp ( wheat color). Error bars, mean ± S.D. of two repeats.
