
Figure 3.
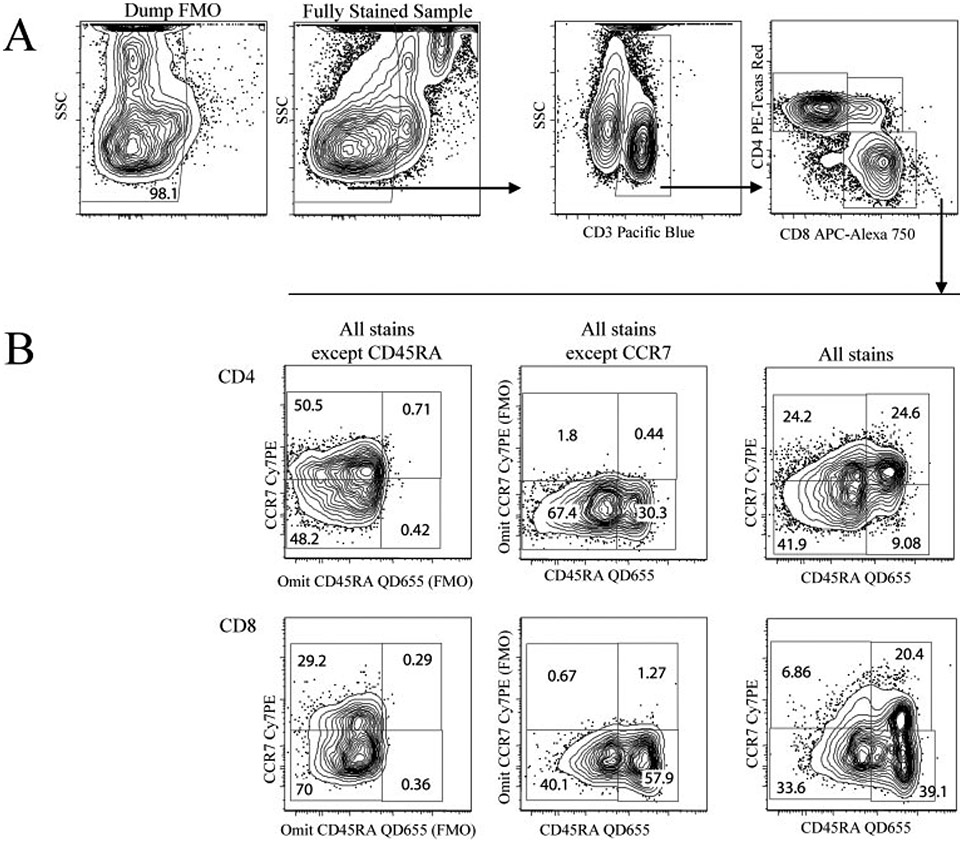
Fluorescence minus one (FMO) controls. To unequivocally identify viable memory and effector T cell subpopulations, all gates were controlled using a stain that lacks just one of the fluorescent markers of interest. (A) Here, 5% contour plots with outliers show how a FMO control (left panel) is used to identify live cells in the fully stained sample (right panel). From there subsequent gating identifies CD3+ and then CD4 and CD8 single-stained cells. (B) Similarly, gating strategies to identify T cell subsets based on CD45RA and CCR7 on CD4 (top) and CD8 (bottom) staining is done comparing each stain to its respective FMO control.