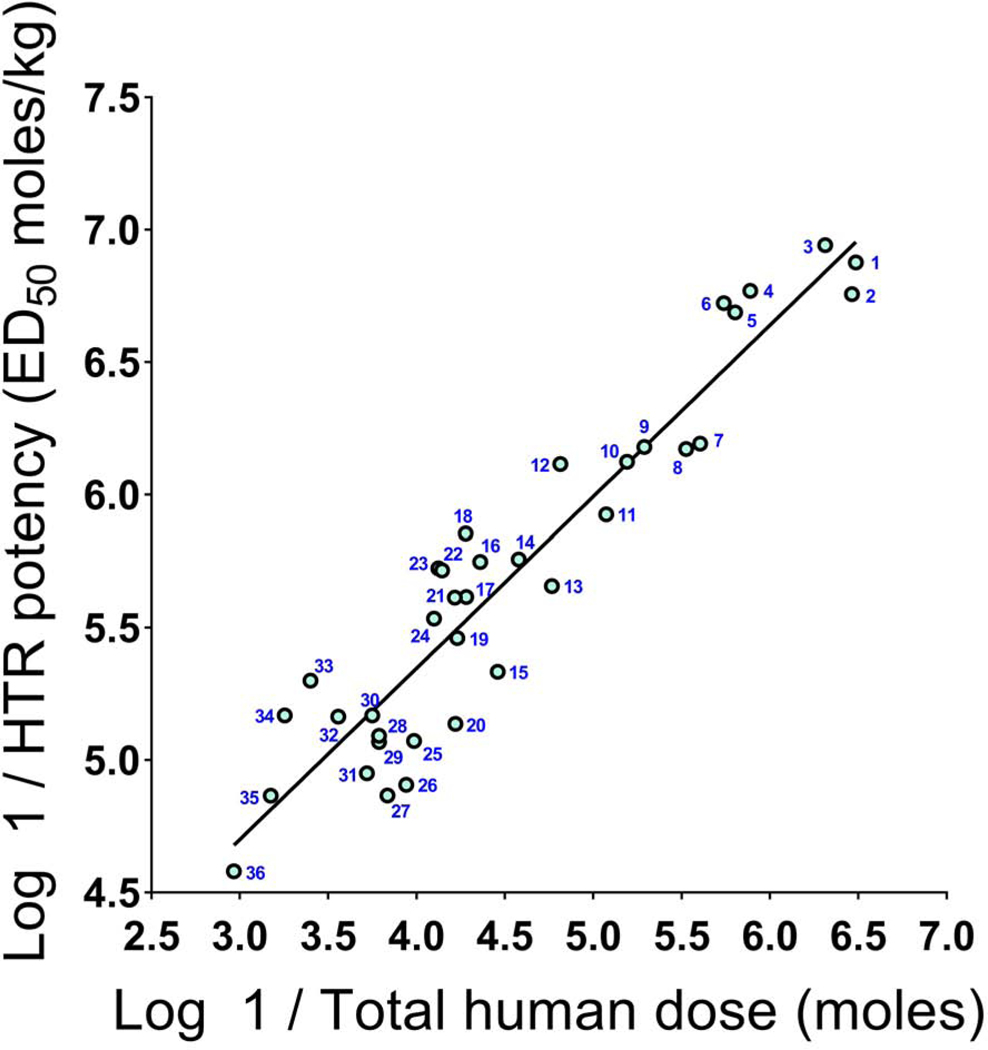
FIGURE 2.
Hallucinogen potencies in humans and mice are robustly correlated (r = 0.9448). The numbers correspond to the agents in Table 3. Potencies in humans are plotted as log 1/total hallucinogenic dose (in moles); potencies in the mouse head-twitch response assay are plotted as log 1/ED50 (in moles/kg).

