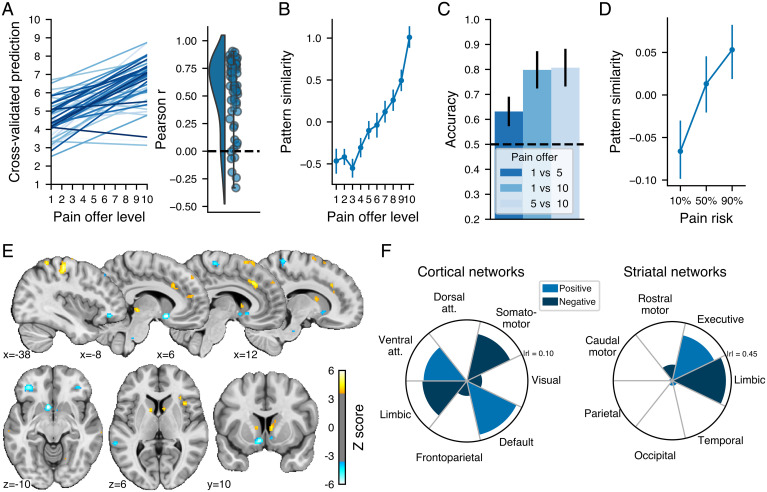
Fig. 2.
Validation and performance of the multivariate pattern predicting pain offer levels and its spatial distribution. (A) Relationship between the actual and predicted pain offer level for each participant (shown in different shades of blue) and the corresponding distribution of the Pearson correlation between actual and predicted levels for each participant. (B) Average z-scored pattern similarity between the multivariate pattern and the parametric maps corresponding to each pain offer level. (C) Binary classification accuracy for different combinations of pain offer levels using the pain pattern similarity. The black dashed horizontal line shows the chance accuracy level. (D) Average z-scored pattern similarity between the multivariate pattern and the parametric maps corresponding to the level of pain risk in an independent dataset. (E) Multivariate pattern predicting the pain offer level thresholded at FDR q < 0.05 using a bootstrap distribution built from 10,000 samples drawn with replacement. The color bar shows the regression weights z-scored using the bootstrap distribution. Note that the multivariate patterns were thresholded for display and interpretation only. All error bars show the SEM. The full unthresholded weight map is available at https://neurovault.org/collections/10410. (F) Correlation between the pattern weights and resting-state (Left) cortical and (Right) striatal networks.

