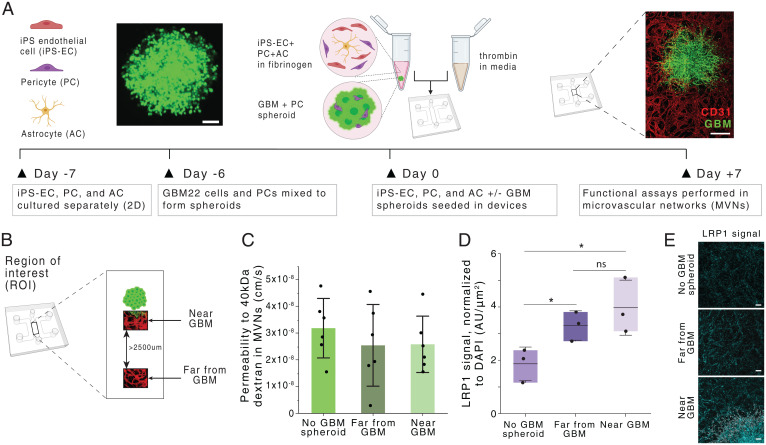
Fig. 1.
Generation and characterization of a glioblastoma BBB MVN model (BBB-GBM model). (A) Schematic of BBB-GBM formation in a microfluidic device. (Scale bars: 100 µm [Left] and 500 µm [Right].) (B) ROIs identified spatially within the BBB-GBM model, with far from GBM ROIs identified to be at least 2,500 µm away from the GBM spheroid. (C) Permeability to 40-kDa dextran in the vascular networks across different ROI locations; each point represents n = 1 device. (D) Expression of LRP1 across different ROI locations, as assessed via immunofluorescence staining; each point represents n = 1 device. (E) Representative micrographs of LRP1 staining quantified in D. (Scale bars: 100 µm.) In all graphs, bars represent mean ± SD. ns, not significant. *P < 0.05. Statistical analyses are described in Materials and Methods. AU, arbitrary units; 2D, two-dimensional.

