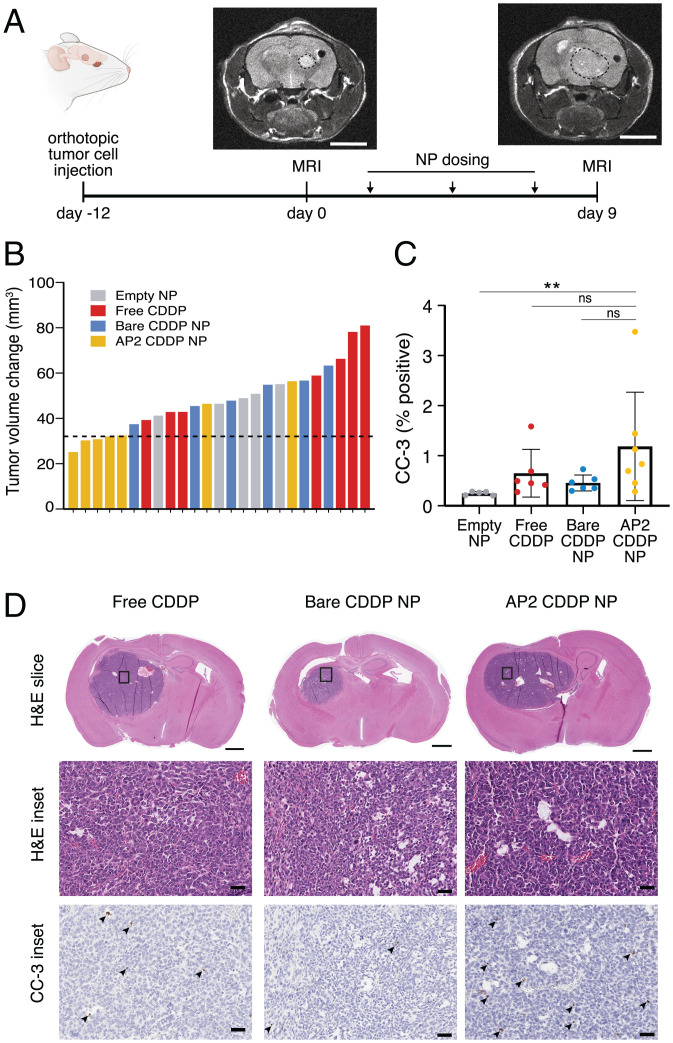
Fig. 5.
BBB-GBM device predicts differential effects of CDDP NP formulations in an orthotopic in vivo model. (A) Timeline of in vivo study with orthotopic GBM tumors using MRI to monitor response to therapeutic NPs. (Scale bars, 4 mm.) (B) Waterfall plot for change in tumor volume after treatment on the y axis, where each bar represents one mouse; dotted line is the median tumor volume change for the AP2 NP group. (C) Quantification of CC-3 staining in tumor tissue. Each dot represents n = 1 mouse. (D) Representative immunohistochemistry micrographs with hematoxylin and eosin (H&E) staining (for context) and CC3, as quantified in C; arrowheads denote CC-3–positive cells. (Scale bars: 50 µm [Middle and Bottom] and 1 mm [Top].) Bars represent mean ± SD. ns, not significant. **P < 0.01. Statistical analyses are described in Materials and Methods.

