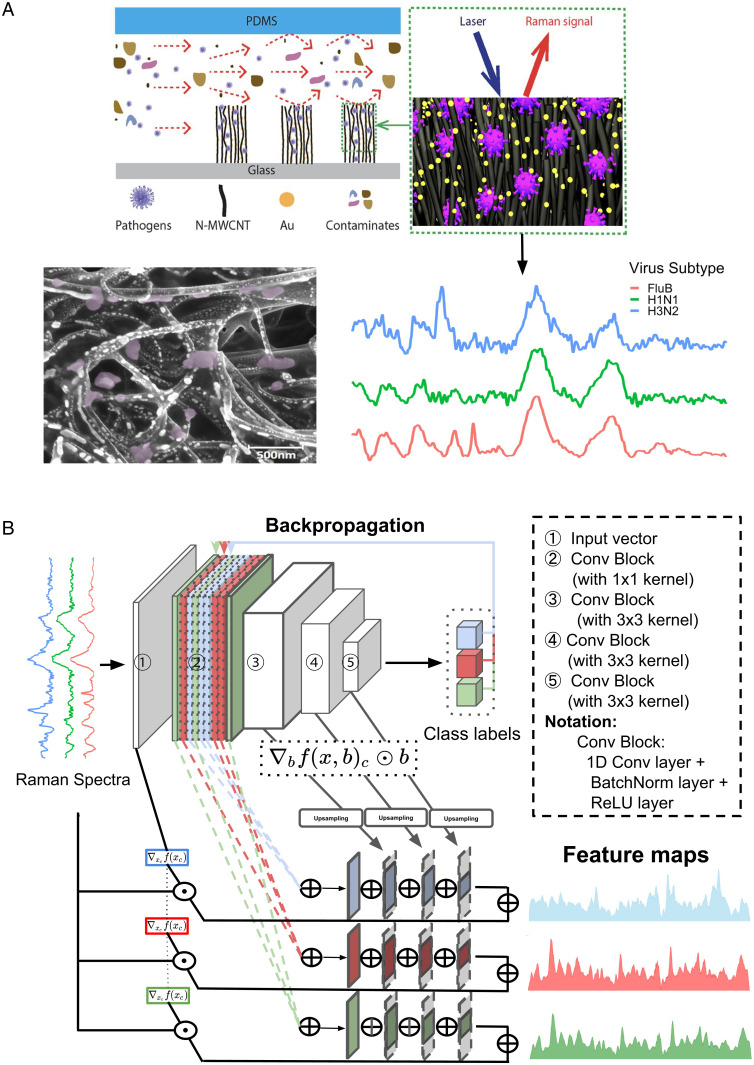
Fig. 1.
(A) Schematics showing the nitrogen-doped multiwall CNTs device encapsulated in polydimethylsiloxane used to enrich viruses (Top Left). The viruses are enriched between CNTs where the Au nanoparticles are predeposited. Raman spectra are then collected from the virus-enriched samples (Top Right). A scanning electron microscope image (Bottom Left) of a sample shows CNTs, Au nanoparticles, and trapped viruses (purple colored). Raman spectra from different virus samples are shown (Bottom Right) (FLUB in red, FLUA H1N1 in green, and FLUA H3N2 in blue). (B) The CNN architecture for virus identification and the process of extracting Raman feature maps show important Raman signature ranges. The feature maps extracted are class specific, demonstrating the significant Raman ranges for identifying different virus types (or subtypes, depending on the classification task) in different colors.

