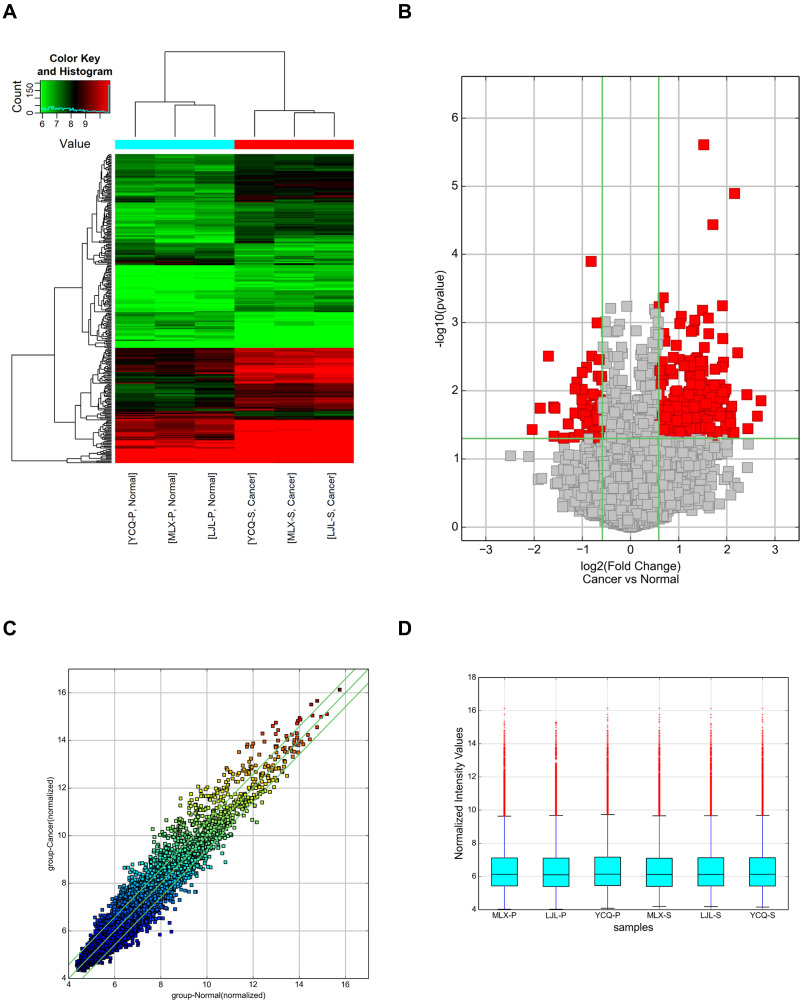
Figure 1.
Differential expression levels of circRNAs in the tumour tissues and normal tissues of LUAD patients. (A) Hierarchical clustering of circRNA microarray analysis from three paired LUAD tumour tissues and matched adjacent normal tissues showed the differential expression of circRNAs (FC ≥ 1.5 and P values ≤ 0.05). (B) Volcano plots were constructed to determine the distribution of circRNAs using the fold change and P values. The left red points represent the differentially downregulated circRNAs, and significantly upregulated circRNAs are shown by right red points. (C) A scatter plot was used to assess variations in circRNA expression levels between LUAD tumour tissues and adjacent normal tissues. The values of the X and Y axes in the scatter plot are the normalized signal values of the samples (log2 scaled). The circRNAs above the top green line and below the bottom green line were changed by more than 1.5-fold between the two compared groups. (D) The box plot shows that the circRNAs were regulated by quantile normalization.

