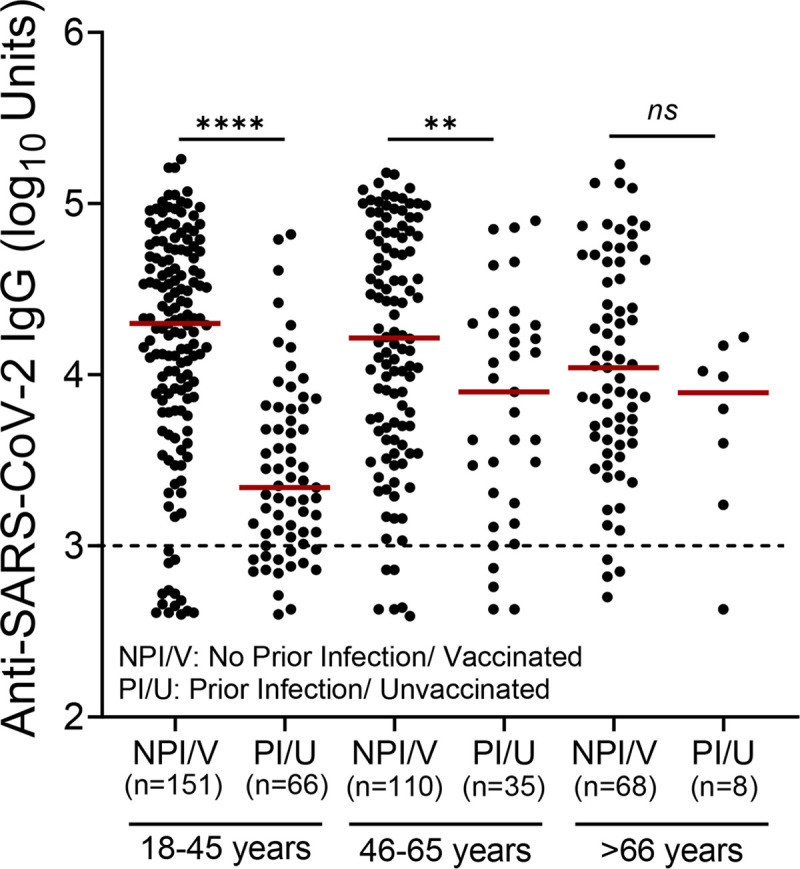
Fig 4. Levels of anti-spike IgG across study groups.

Dot plots show the levels of anti-spike IgG in individuals without evidence of prior infection (NPI/V) who received one dose or two doses of a vaccine and unvaccinated individuals with evidence of prior infection (PI/U). The Mann-Whitney U-test was employed to compare the IgG levels in age groups. Statistically significant differences are indicated with asterisks: **p<0.01, ****p<0.0001, ns: non-significant. Horizontal bars indicate median values.
