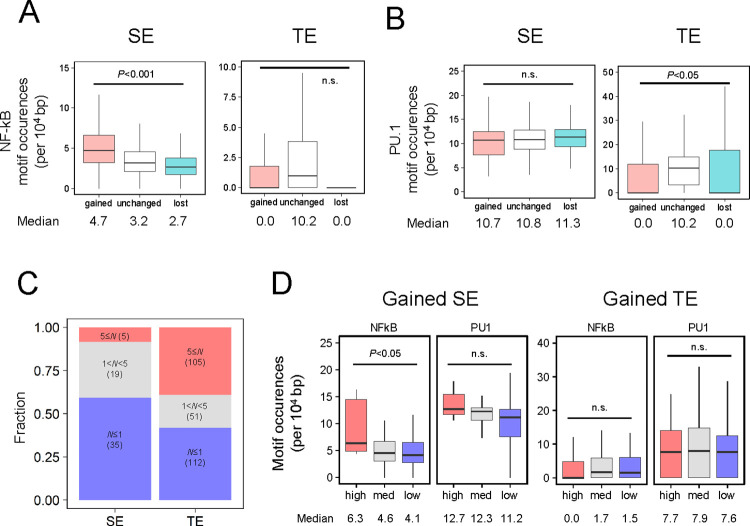
Fig 4. Motif and Hill function analysis.
(A-B) Motif occurrences of (A) NF-κB and (B) PU.1 at SE and TE calculated using the “findMotifsGenome.pl” program with the “-find” option of Homer. Number of peaks: Gained SE, 280; Unchanged SE, 669; Lost SE, 280; Gained TE, 9024; Unchanged TE, 18050; Lost TE, 9021. TE for genes annotated for both SE and TE were removed. P-value was calculated using one-way ANOVA with undersampling (n = 280), n.s.: not significant. (C) Bar plot of the Hill coefficient for mean gene expression across doses. Genes with Hill coefficient > 9 and < 0.3 were removed. (D) Boxplot of motif occurrences for NF-kB and PU.1 at gained SE and gained TE with categorized Hill coefficients. High, 5 ≤ N < 9; Med, 1 < N < 5; Low, N ≤ 1. P-values were calculated using one-way ANOVA with undersampling, except for gained SE in the high category (n = 19), n.s.: not significant.

