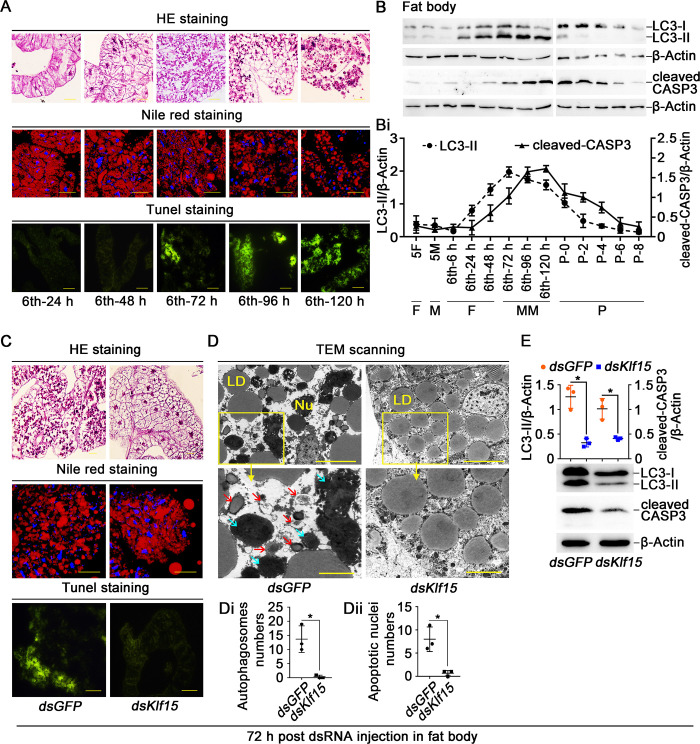
Fig 3. Knockdown of Klf15 repressed fat body degradation.
A. The morphological changes of fat body were assessed by HE staining, Nile red staining and TUNEL staining, the ruler represents 50 μm in the HE staining. Nile red stained for intracellular LD, the ruler represents 50 μm. The apoptotic cells in the fat body were determined by TUNEL staining assay, the ruler represents 100 μm. B. Western blotting detection of LC3-II and cleaved-CASP3 protein levels in the fat body using anti-LC3 and anti-CASP3 antibodies, with β-Actin as protein control after 15% SDS-PAGE. Bi. Quantification of the data in B. C. HE staining, Nile red staining and TUNEL staining showing fat body morphology after knockdown Klf15, observed after first injection dsRNA for 72 h. D. TEM observation after injection with dsKlf15 in the fat body. The bars in the wide field view represented 100 μm, in the small field view represented 40 μm. The red arrows indicated autophagosomes, the blue arrow represented the apoptotic nuclei. Nu: nucleus, LD: lipid droplets. Di. Counted the autophagosomes contained in three different sets of images. The area of each image is about 0.09 mm2. Dii. Counted the apoptotic nuclei of dsGFP and dsKlf15. E. After knockdown dsGFP and dsKlf15, western blotting detected LC3-II and cleaved-CASP3. 72 h post dsRNA injection in fat body: 72 h post dsRNA injection into hemocoel and observed the variation in the fat body.

