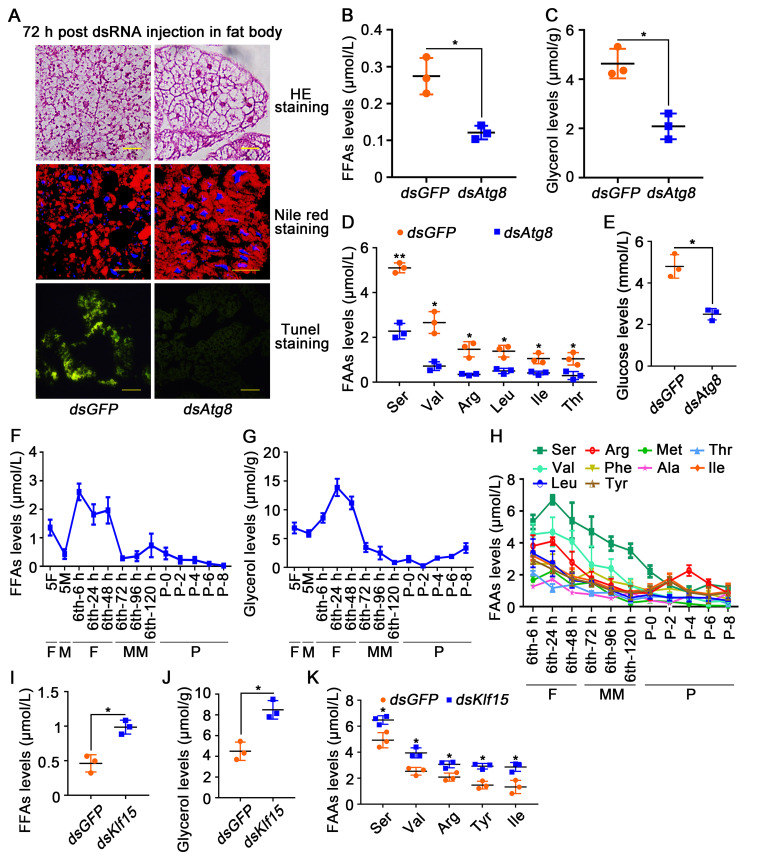
Fig 6. Autophagy presented substrates for gluconeogenesis.
A. HE staining, Nile red staining and TUNEL staining showing the morphology of fat body after dsGFP and dsAtg8 injection into hemocoel. B and C. Levels of FFAs in the hemolymph and glycerol in the fat body after knockdown of Atg8. D. FAAs levels in the hemolymph after knockdown of Atg8. E. Glucose levels in the hemolymph decreased after knockdown Atg8. F and G. FFAs levels in the hemolymph and glycerol levels in the fat body from 5th instar larvae to 8-day-old pupae. H. FAAs levels in the hemolymph. I and J. FFAs and glycerol levels after first injection dsKlf15 for 72 h. K. FAAs levels after knockdown of Klf15.

