
Figure 3:
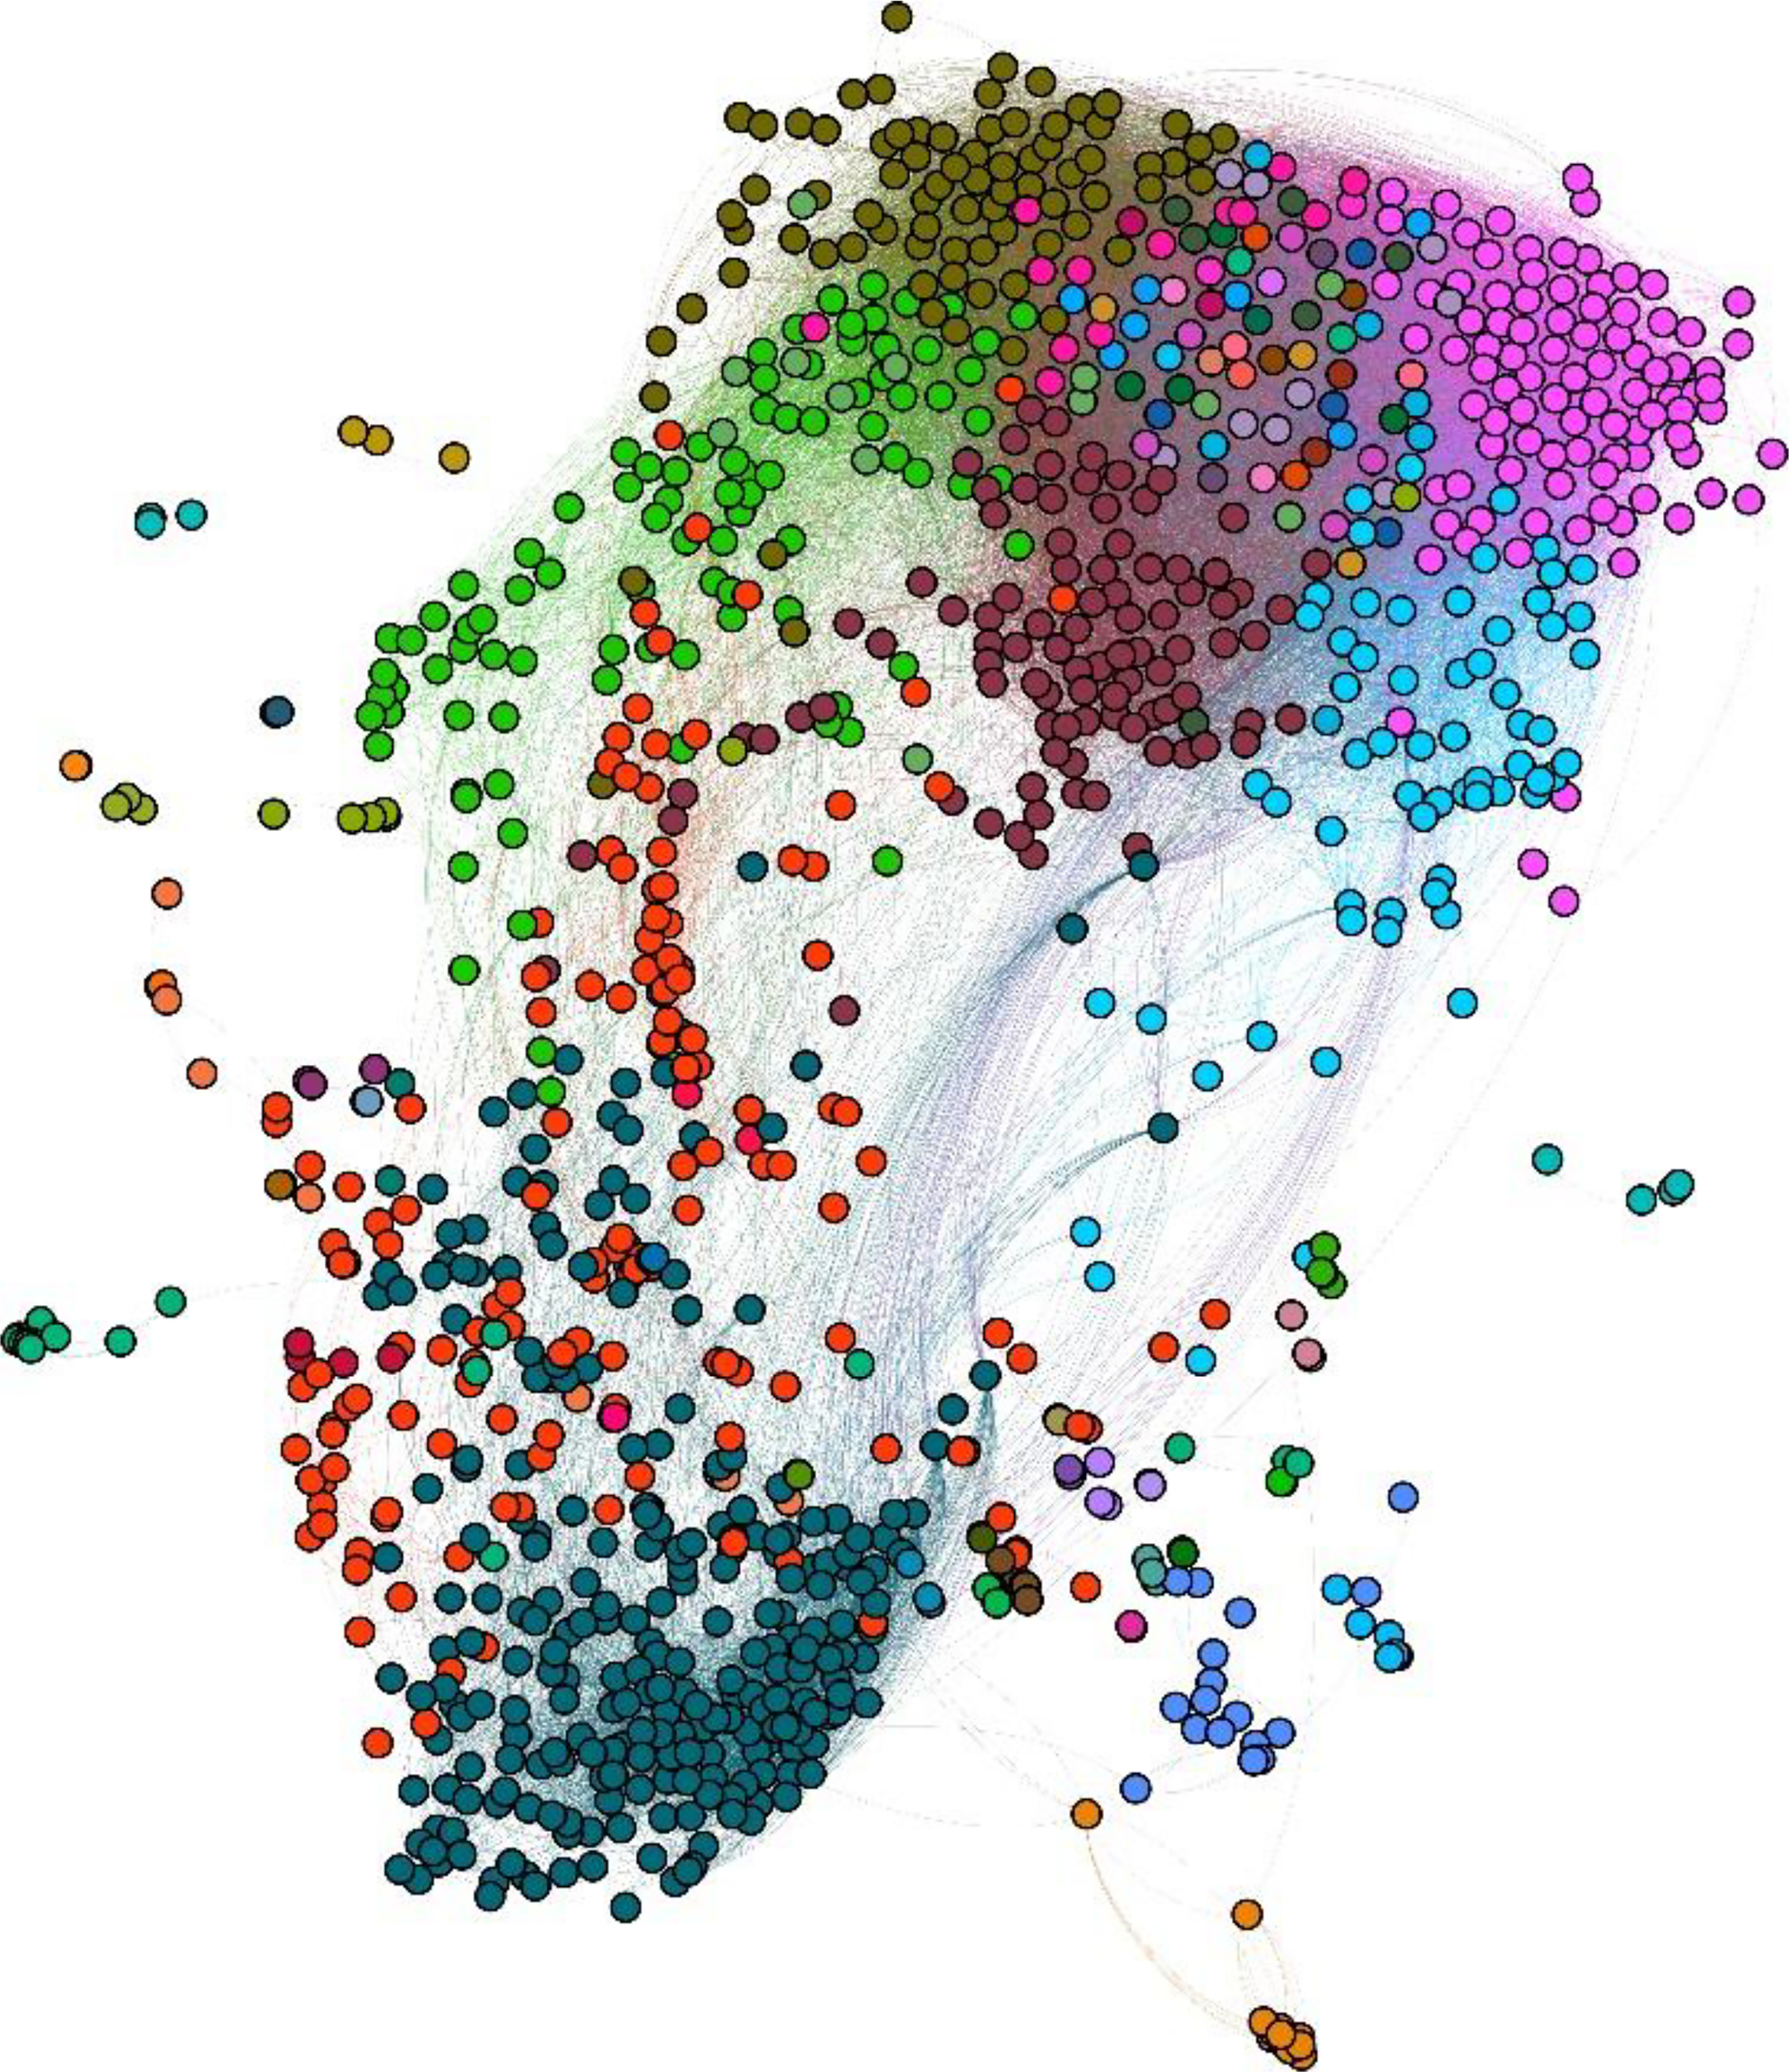
Cluster map of in vitro PubChem and Toxicity Forecaster (ToxCast) assays based on correlations between chemical fragments and assay activities. The Louvain modularity algorithm identified 68 clusters, each represented by a different color, as outlined in Supplementary Table 2. Each colored circle represents one bioassay such that circles of the same color belong to the same cluster. Each edge inversely correlates to the similarity between the connected assays, with longer edges representing lower similarity.