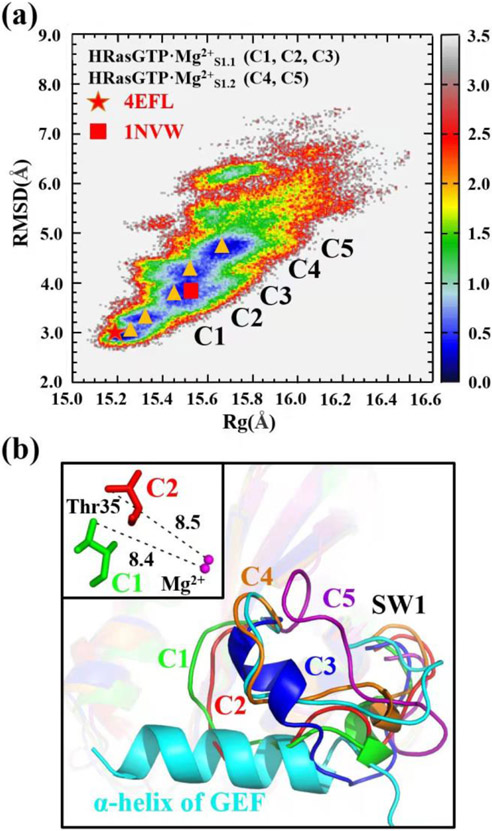
Figure 3.
(a) Constructed 2D-FEL of State 1 of HRasGTP·Mg2+ with respect to the RMSD (relative to the reference structure 3L8Z) and Rg of heavy atoms. C1-C5 denote the representative conformations of the five free energy minima marked with the orange triangles on the 2D-FEL. The C1-C5 conformations represent the two substates HRasGTP·Mg2+S1.1 (C1, C2, C3) and HRasGTP·Mg2+S1.2 (C4, C5), respectively. The red pentagram and square denote the projection of the crystal structures 4EFL and Ras in 1NVW. The unit of the energy scale bar is kcal/mol. (b) The least-square fitting of C1-C5 conformations to 1NVW shows that the loops of C1, C2 and C3 overlap with the α-helix of GEF. The inset shows the distances between Thr35 and Mg2+ in the C1 and C2 conformations.

