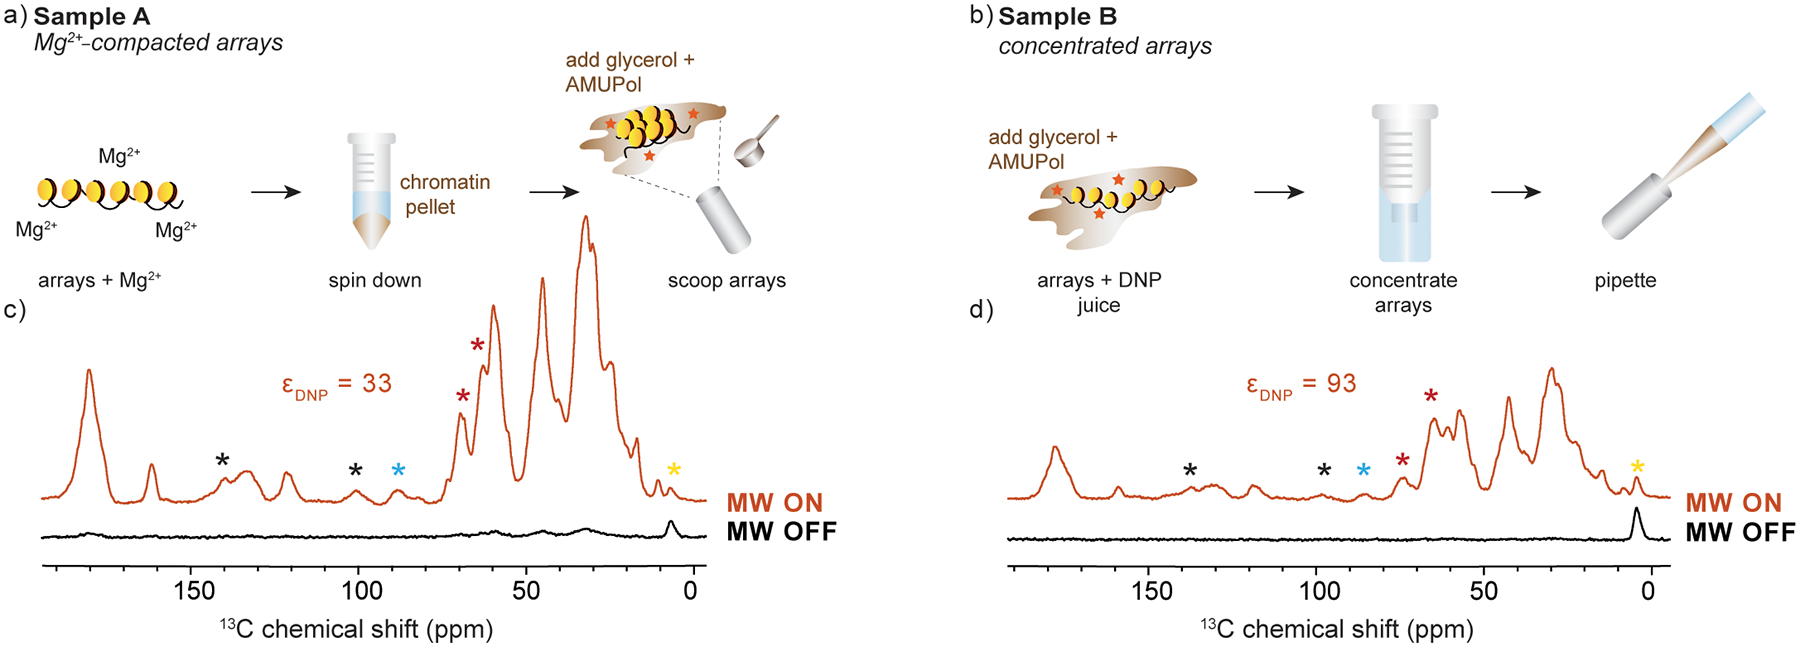
Figure 1.

(a-b) Sample preparation and DNP MAS rotor packing methods for Sample A and Sample B, respectively. (c-d) Low temperature 1D 13C spectra with DNP (MW on, orange) and without DNP (MW off, black) for Sample A and Sample B, respectively. Each spectrum was acquired at ω1H = 600 MHz and 100 K with 64 scans and ωr =12 kHz. Red asterisks denote natural abundance glycerol peaks, black asterisks denote spinning sidebands, yellow asterisks denote a peak arising from the DNP rotor silicon plug, and blue asterisks denote natural abundance DNA signals. εDNP – representative DNP enhancement for each sample.
