Figure 2.

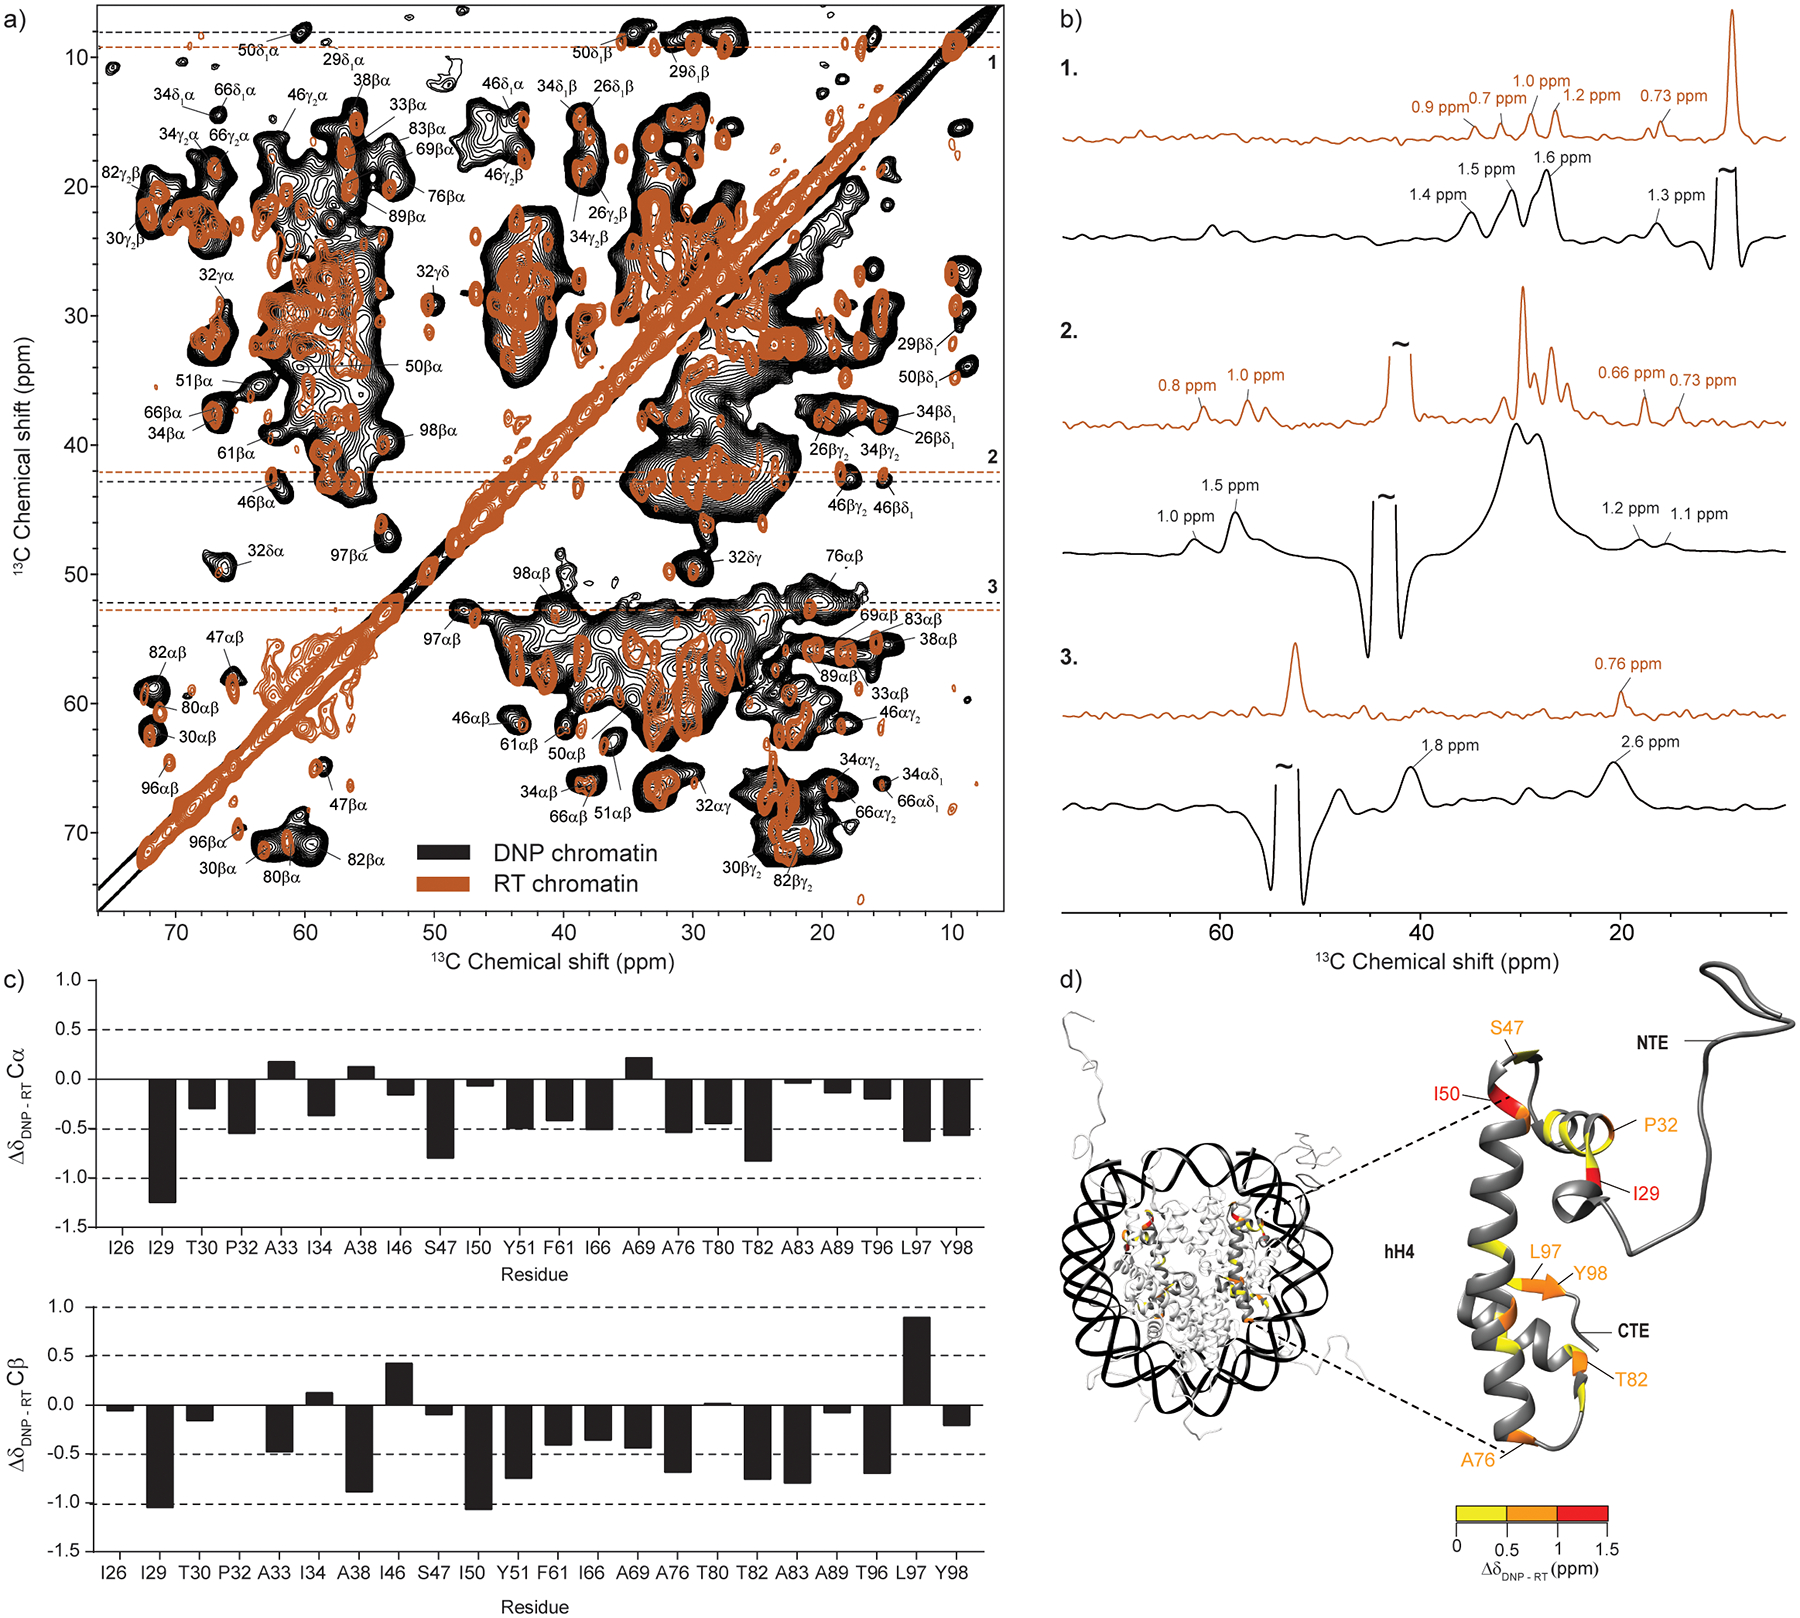
(a) Overlay of DNP-enhanced and room-temperature 13C-13C DARR correlation spectra of 13C,15N-labeled H4 nucleosome array samples. The DNP spectrum (black) was acquired at 100 K and ω1H = 600 MHz with 16 scans, ωr =12.5 kHz and 10 ms DARR mixing time. Sample contained 0.4 mg of labeled protein. The room temperature spectrum (brown) was acquired at 275 K and ω1H = 750 MHz with 64 scans, ωr =11.1 kHz and 20 ms DARR mixing time. Sample contained 1 mg of labeled protein. The labels correspond to assignments obtained at 275 K according to ref. [16]. (b) Representative slices and linewidths in the two spectra. (c) Analysis of the Cα and Cβ chemical shift changes for resolved correlations in the spectra. (d) Chemical shift changes for histone H4 mapped on the nucleosome surface (PDB ID: 1KX5, ref. [4]). H4 residues with no resolved Cα and Cβ correlations in the DNP spectrum are shown in dark grey. The color coding reflects the largest of either the Cα or Cβ chemical shift change.
