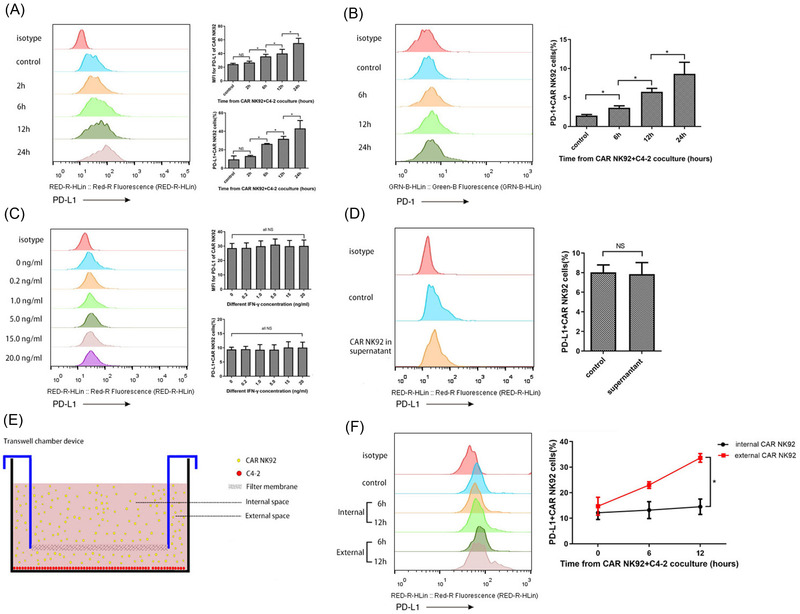
FIGURE 2.

Upregulation of PD‐L1 expression on CAR NK‐92 cells cocultured with C4‐2 cells was dependent on direct cell contact. (A) Representative flow cytometry images and summary data (n = 3) showing the expression of PD‐L1 on CAR NK‐92 cells cocultured with C4‐2 cells for 2, 6, 12 and 24 h. The MFI for PD‐L1 and PD‐L1+ percentages of CAR NK‐92 cells were significantly increased in a time‐dependent manner. (B) Representative flow cytometry images and summary data (n = 3) showing the expression of PD‐1 on CAR NK‐92 cells cocultured with C4‐2 cells for 6, 12 and 24 h. The percentages of PD‐1+ CAR NK‐92 cells were significantly upregulated in a time‐dependent manner. (C) PD‐L1 expression on CAR NK‐92 cells stimulated with different concentrations of IFN‐γ (n = 3). There was no significant change in MFI for PD‐L1 or PD‐L1+ percentages of CAR NK‐92 cells after IFN‐γ stimulation. (D) Representative flow cytometry images and summary data (n = 3) showing the expression of PD‐L1 on CAR NK‐92 cells incubated with normal medium or supernatants acquired from coculture medium for 12 h. There was no significant difference in PD‐L1+ percentages of CAR NK‐92 cells cultured in the two culture mediums. (E) Schematic diagram of the trans‐well chamber device. C4‐2 cells were seeded at the bottom, and CAR NK‐92 cells were cultured in the full medium of the device. The internal and external space was separated by a filter membrane, which allowed the cytokines to pass through but blocked the exchange of CAR NK‐92 cells. (F) PD‐L1 expression on CAR NK‐92 cells cultured in internal and external spaces for 6 and 12 h (n = 3). The PD‐L1+ percentages of CAR NK‐92 cells incubated in an external space were significantly increased at 6 and 12 h, while the PD‐L1+ percentages of CAR NK‐92 cells incubated in a trans‐well chamber did not show any significant changes. Bars represent the means ± SD, ANOVA followed by a Tukey post hoc test was used for multiple group comparisons (A, B, C), and Student's t‐test was used for two‐group comparisons (D, F). *p < .05; NS, not significant
