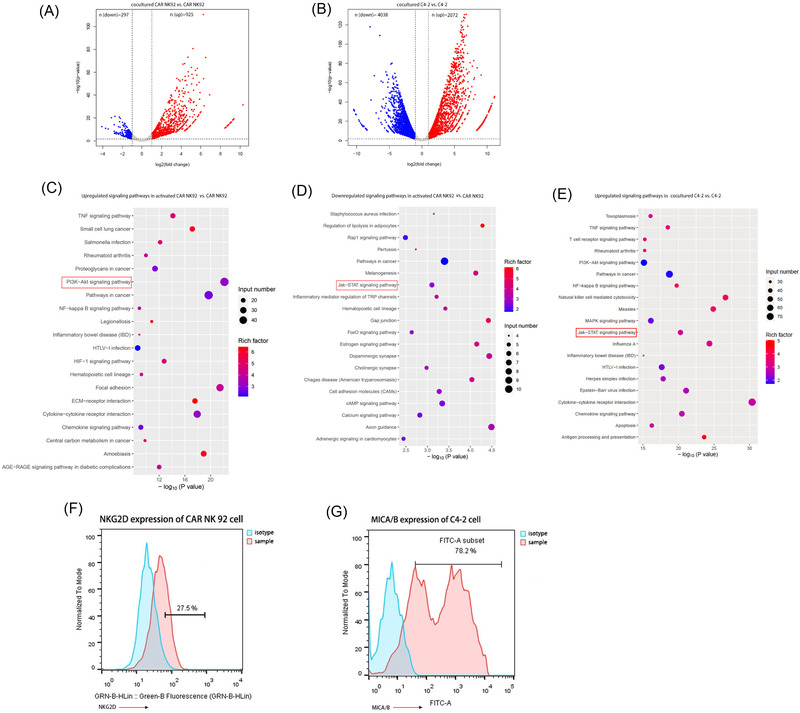
FIGURE 3.

Transcriptional analysis of CAR NK‐92 and C4‐2 cells after coculture. (A) Volcano plots of the dysregulated genes between cocultured and uncocultured CAR NK 92 cells. (B) Volcano plots of the dysregulated genes between cocultured and uncocultured C4‐2 cells. In (A) and (B), genes differentially expressed with a fold change greater than 2.0 and p < .05 are marked in colour. The p‐values were calculated using a two‐sided unpaired Student's t‐test. (C) Kyoto Encyclopedia of Genes and Genomes (KEGG) pathway enrichment analysis of upregulated genes in CAR NK‐92 cells following incubation with C4‐2 cells. (D) KEGG pathway enrichment analysis of downregulated genes in CAR NK‐92 cells following incubation with C4‐2 cells. (E) KEGG pathway enrichment analysis of upregulated genes in C4‐2 cells following coculture with CAR NK‐92 cells. In (C, D, E,) the colour of the dots represents the rich factor, and the size represents the input number of each KEGG term. The horizontal axis indicates the significance of enrichment. The vertical axis indicates the enriched KEGG pathway (20 most enriched terms). (F) Representative flow cytometry plots and data (n = 3) of NKG2D expression on CAR NK‐92 cells. (G) Representative flow cytometry plots and data (n = 3) of MICA/B expression in C4‐2 cells.
