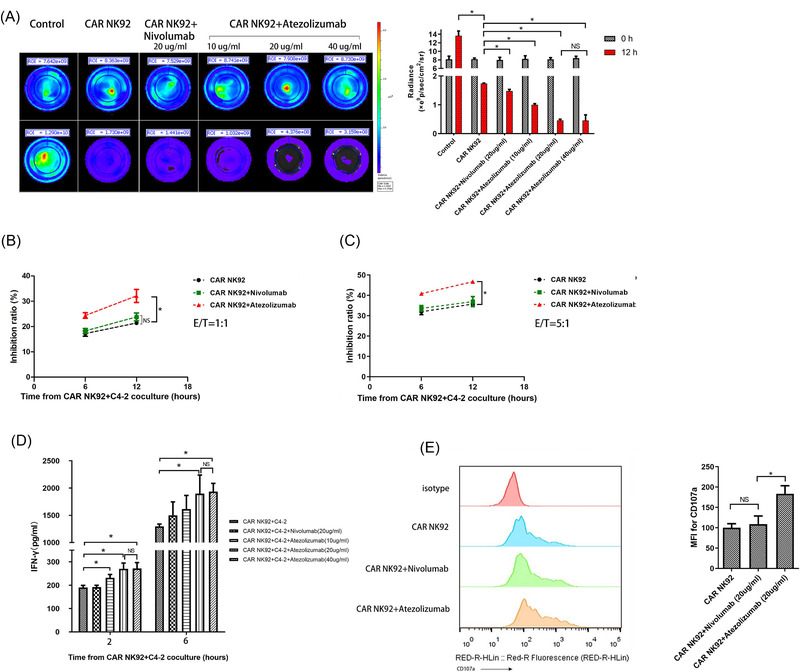
FIGURE 5.

Detection of the cytotoxic activity of CAR NK‐92 cells treated with atezolizumab or nivolumab. (A) Representative BLI of C4‐2GFP cells in the control and treatment groups, including the CAR NK‐92, CAR NK‐92+nivolumab (20 μg/ml) and CAR NK‐92+atezolizumab (10, 20, 40 μg/ml) groups (n = 3). (B, C) The inhibition ratios of CAR NK‐92, CAR NK‐92+nivolumab (20 μg/ml), CAR NK‐92 + atezolizumab (20 μg/ml) treatment measured using the Cell Counting Kit‐8 (CCK‐8) assay (n = 3). E/T = 1:1, 5:1, respectively. (D) IFN‐γ levels in the culture supernatant of CAR NK‐92 cells cocultured with C4‐2 cells in the control and treatment groups, including CAR NK‐92, CAR NK‐92 + nivolumab (20 μg/ml) and CAR NK‐92+atezolizumab (10, 20, 40 μg/ml), measured by ELISA at 2 and 6 h (n = 3). (E) Representative flow cytometry plots and summary data (n = 3) showing CD107a expression in CAR NK‐92 cells cocultured with C4‐2 cells in the presence of atezolizumab or nivolumab. Degranulation of CAR NK‐92 cells was induced upon interaction with C4‐2 cells at a 1:1 ratio for 20 h at 37°C, and then CAR NK‐92 cells were collected and treated with atezolizumab (20 μg/ml) or nivolumab (20 μg/ml), followed by flow cytometry measurement. Data expressed as the means ± SD were plotted, and ANOVA followed by a Tukey post hoc test was used to compare three or more groups (A–E). *p < .05; BLI, bioluminescent intensity; E/T, effector‐to‐target ratio; NS, not significant
