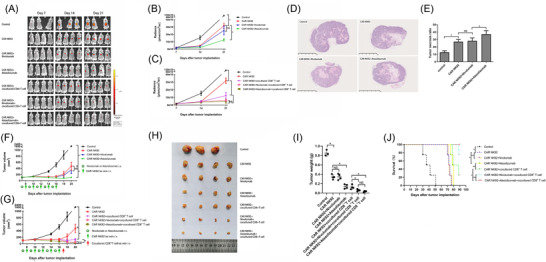
FIGURE 6.

Antitumour effect of CAR NK‐92 cells against C4‐2 cells in combination with atezolizumab or nivolumab in the presence or absence of CD8+ T cells in vivo. (A) BLI measurements of the tumours arising from C4‐2GFP cells implanted in mice were performed in the control and treatment groups, including CAR NK‐92, CAR NK‐92+nivolumab, CAR NK‐92+atezolizumab, CAR NK‐92+cocultured CD8+ T cells, CAR NK‐92+nivolumab + cocultured CD8+ T cells and CAR NK‐92+atezolizumab + cocultured CD8+ T‐cell groups on Days 7, 14 and 21 (n = 3–4). (B) Quantitative BLIs of tumour activity in the control and treatment groups, including the CAR NK‐92, CAR NK‐92 + nivolumab and CAR NK‐92 + atezolizumab groups, on Days 7, 14 and 21 (n = 3–4). (C) Quantitative BLIs of tumour activity in the control and treatment groups, including CAR NK‐92, CAR NK‐92 + cocultured CD8+ T cells, CAR NK‐92+nivolumab + cocultured CD8+ T cells and CAR NK‐92 + atezolizumab + cocultured CD8+ T cells, on Days 7, 14 and 21 (n = 3–4). (D) Representative HE‐stained tumour sections from the control, CAR NK‐92, CAR NK‐92 + nivolumab and CAR NK‐92 + atezolizumab groups (n = 3–4). Evident tumour necrosis was observed in the CAR NK‐92 cell treatment group; atezolizumab significantly increased the severity of CAR NK‐92 cell‐induced necrosis. (E) Statistical analyses of the tumour necrosis ratio at Day 21 after implantation (n = 3–4). (F) Tumour volumes in the control and treatment groups, including CAR NK‐92, CAR NK‐92 + nivolumab and CAR NK‐92 + atezolizumab groups, were assessed on Days 7, 10, 14, 16, 18 and 20. Tumour volumes were calculated according to the formula L × W2/2, where L and W represent the longest and shortest diameters measured by a calliper, respectively (n = 3–4). (G) Tumour volumes in the control and treatment groups, including CAR NK‐92, CAR NK‐92 + cocultured CD8+ T cell, CAR NK‐92 + nivolumab + cocultured CD8+ T cell, CAR NK‐92 + atezolizumab + cocultured CD8+ T‐cell groups on Days 7, 10, 14, 16, 18 and 20 (n = 3–4). (H) Tumours excised from euthanised mice were photographed, measured and compared in each group (n = 3–4). (I) Tumour weights corresponding to each group when harvested on Day 21 (n = 3–4). (J) Cumulative Kaplan–Meier survival curves for mice (n = 4, log‐rank test). Values are expressed as the means ± SD, and ANOVA followed by a Tukey post hoc test was used for multiple group comparisons (B, C, E, F, G, I). The Kaplan–Meier method was used to estimate survival functions, and the log‐rank test was used for group comparisons (J). *p < .05; BLI, bioluminescent intensity; NS, not significant
