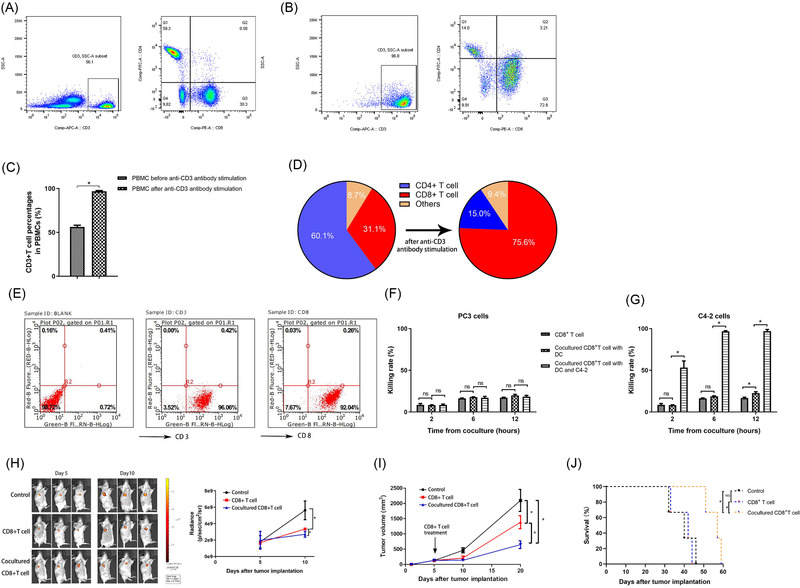
FIGURE 7.

Identification of PBMC constitution in the CD8+ T‐cell–cell culture process and functional verification of the cocultured CD8+ T cells. (A) Detection of CD3 expression in PBMCs and CD4 and CD8 expression in selected T cells among PBMCs using flow cytometry (n = 3) before incubation with anti‐CD3 antibody, IFN‐γ, IL‐1α and IL‐2. (B) Detection of CD3 expression in PBMCs and CD4 and CD8 expression in T cells using flow cytometry after culture with anti‐CD3 antibody and other cytokines, including IFN‐γ, IL‐1α and IL‐2. (C) Statistical analysis of the results of CD3+ T‐cell percentages in PBMCs before and after culture with anti‐CD3 antibody and other cytokines (n = 3). (D) Statistical analysis of the CD4+ and CD8+ T‐cell percentages in the selected T cells of PBMCs before and after culture with anti‐CD3 antibody and other cytokines (n = 3). (E) Detection of CD3 and CD8 expression in the final cocultured CD8+ T cells using flow cytometry (n = 3). The cocultured CD8+ T cells were acquired after incubation with DCs, CD8+ T cells and C4‐2 cells. (F) The cytotoxicity of CD8+ T cells, CD8+ T cells cocultured with DCs and CD8+ T cells cocultured with DCs and C4‐2 cells against PC3 cells was assessed by CCK‐8 assays at the indicated time points. (G) The cytotoxicity of CD8+ T cells, CD8+ T cells cocultured with DCs and CD8+ T cells cocultured with DCs and C4‐2 cells against C4‐2 cells was assessed by CCK‐8 assays at the indicated time points. Data are shown as the mean ± SD of three independent experiments for (F and G). *p < .05; DC, dendritic cell; NS, not significant. (H) BLI measurements of the tumours originating from C4‐2GFP cells implanted in mice in the control group, CD8+ T‐cell treatment group and cocultured CD8+ T‐cell treatment group on Day 5 and day 10 and statistical analysis of the above BLI results (n = 3). (I) Tumour volumes in the control group, CD8+ T‐cell treatment group, and cocultured CD8+ T‐cell treatment group were assessed on Days 5, 10 and 20 (n = 3). Tumour volumes were calculated according to the formula as mentioned. (J) Cumulative Kaplan–Meier survival curves for mice in the control group, CD8+ T‐cell treatment group and cocultured CD8+ T‐cell treatment group (n = 3, log‐rank test). Values are expressed as the means ± SD. Student's t‐test was used for two group comparisons (C), and one‐way ANOVA was used to compare three groups (F, G, H, I). The Kaplan–Meier method was used to estimate the survival functions, and the log‐rank test was used for group comparisons (J). *p < .05; BLI: bioluminescent intensity; NS, not significant
