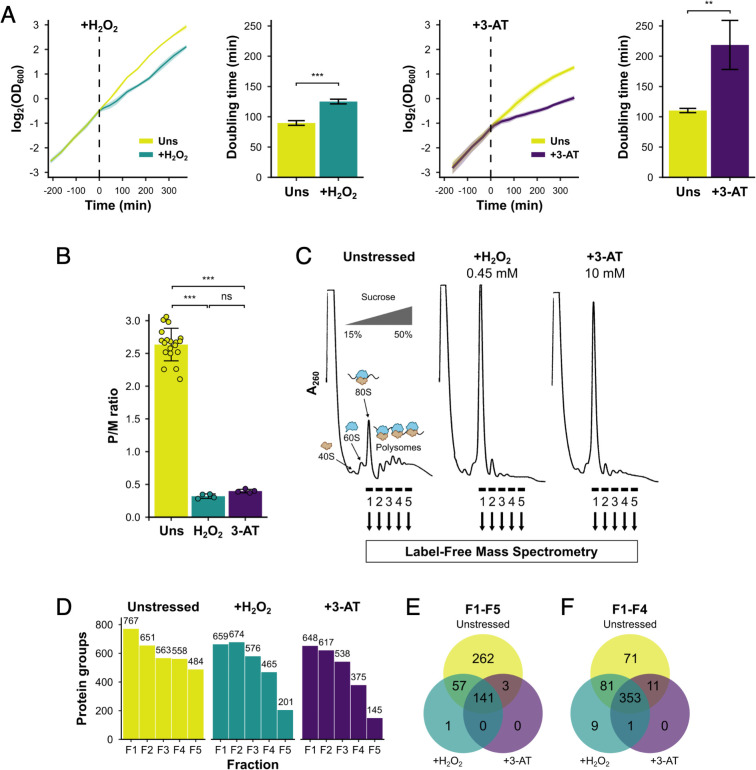
Figure 1. Identification of translational regulators using polysomal proteomics.
(A) Growth curves and doubling times for unstressed, 0.45 mM hydrogen peroxide (H2O2)-treated and 10 mM 3-amino-1,2,4-triazole (3-AT)-treated cultures (n = 3). The time of H2O2 or 3-AT addition is indicated. (B) Quantification of polysome-to-monosome (P/M) ratios under the three conditions (n = 4–19). Error bars show standard deviation (SD). The t-test was used to compare the conditions: ns – not significant (p > 0.05), **p < 0.01, ***p < 0.001. (C) Overview of polysomal proteomics. Monosomal (F1) and polysomal (F2–F5) fractions were isolated from unstressed, H2O2- and 3-AT-treated extracts and analysed using label-free mass spectrometry (MS). (D) The number of proteins identified reproducibly (≥2 replicates) in each fraction. Venn-style diagrams of overlaps between conditions for proteins found across (E) all five fractions or (F) the first four fractions.


