. 2022 May 27;11:e73466. doi: 10.7554/eLife.73466

Figure 2. The ribosome association of initiation factors decreases during stress.

(A) Ribosome association of proteins in F1–F4 under all three conditions (353 proteins). The proportion of each protein that is ribosome associated (% ribosomal) was estimated by comparing the summed intensity in the fractions with the totals (see Methods). Protein groups are coloured by their functional category: RP – ribosomal protein, TF – translation factor, RBP – RNA-binding protein, non-RBP – other protein. The number of proteins in each functional category is indicated. (B) The change in overall ribosome association during both stresses for selected translation-related proteins. Statistically significant changes in ribosome association (p < 0.05) are indicated by arrows: blue – decrease, red – increase.
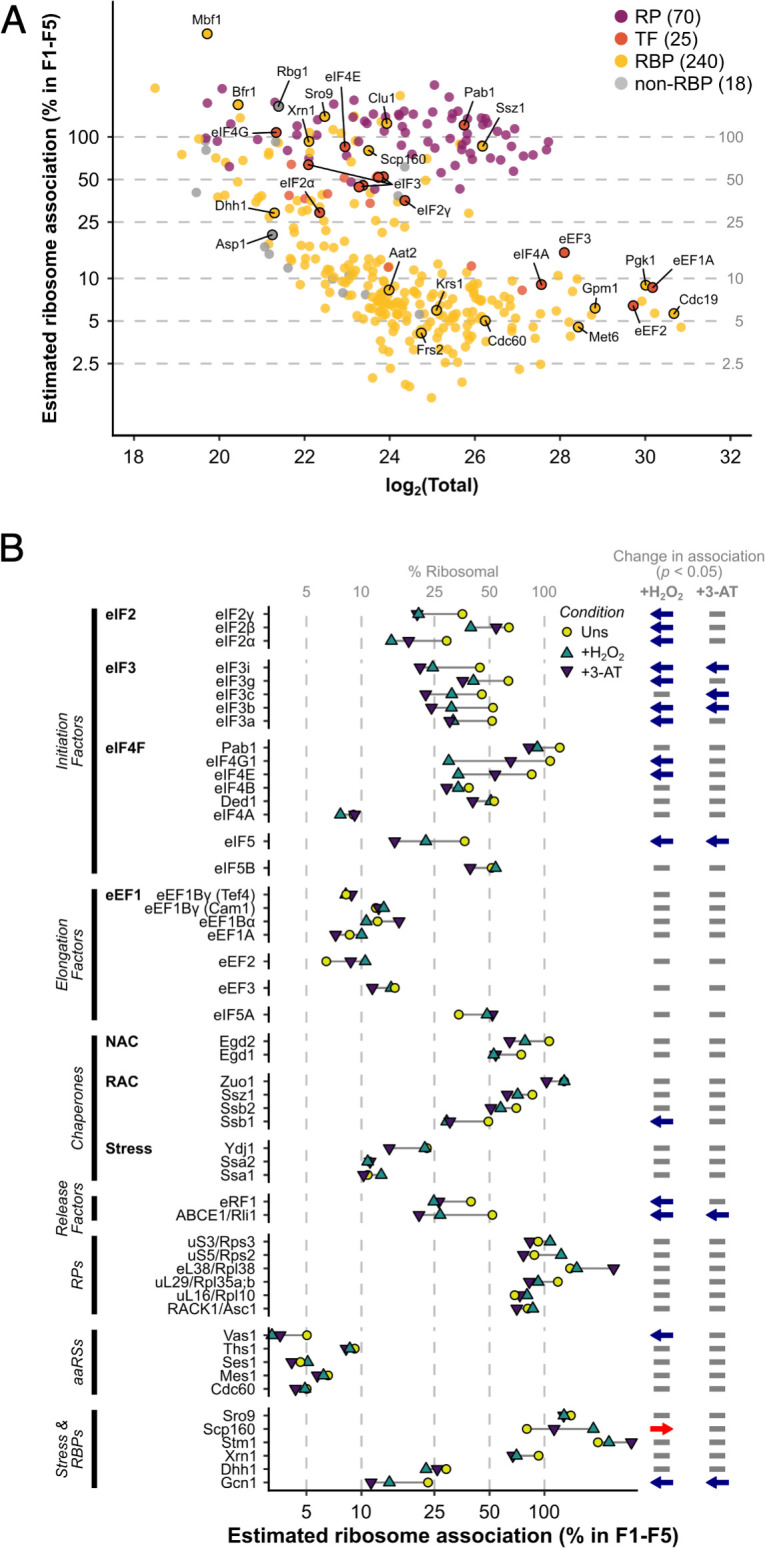
Figure 2.

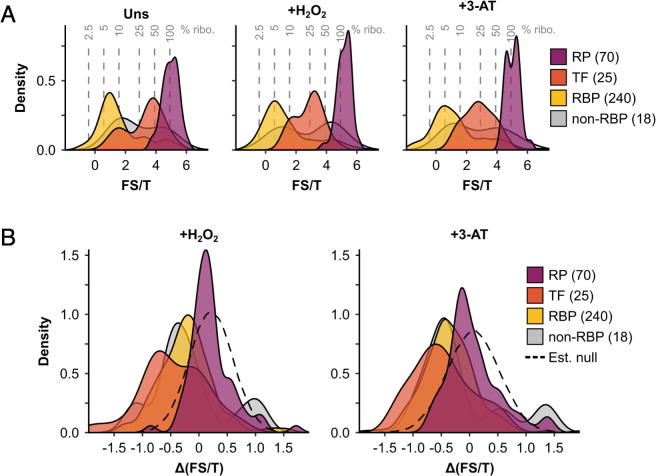
Figure 2—figure supplement 1. The ribosome association of initiation factors decreases during stress.

Figure 2—figure supplement 1.

(A) Density plots showing fraction sum-to-total ratios (FS/T) of proteins in F1–F4 under all three conditions (353 proteins), separated by functional category. Percentage ribosome association (% ribo.) was estimated from FS/T for each protein (see Methods), and is indicated by the grey dotted lines. (B) Density plots showing changes in ribosome association (ΔFS/T) during both stresses for proteins in the four functional categories. The estimated null distributions (dotted lines, ‘Est. null’) are normal distributions with the same mean and standard deviation as the RPs under each condition. These were used to calculate p values for changes in ribosome association (see Methods). RP – ribosomal protein, TF – translation factor, RBP – RNA-binding protein, non-RBP – other protein. The number of proteins in each functional category is indicated in parenthesis.