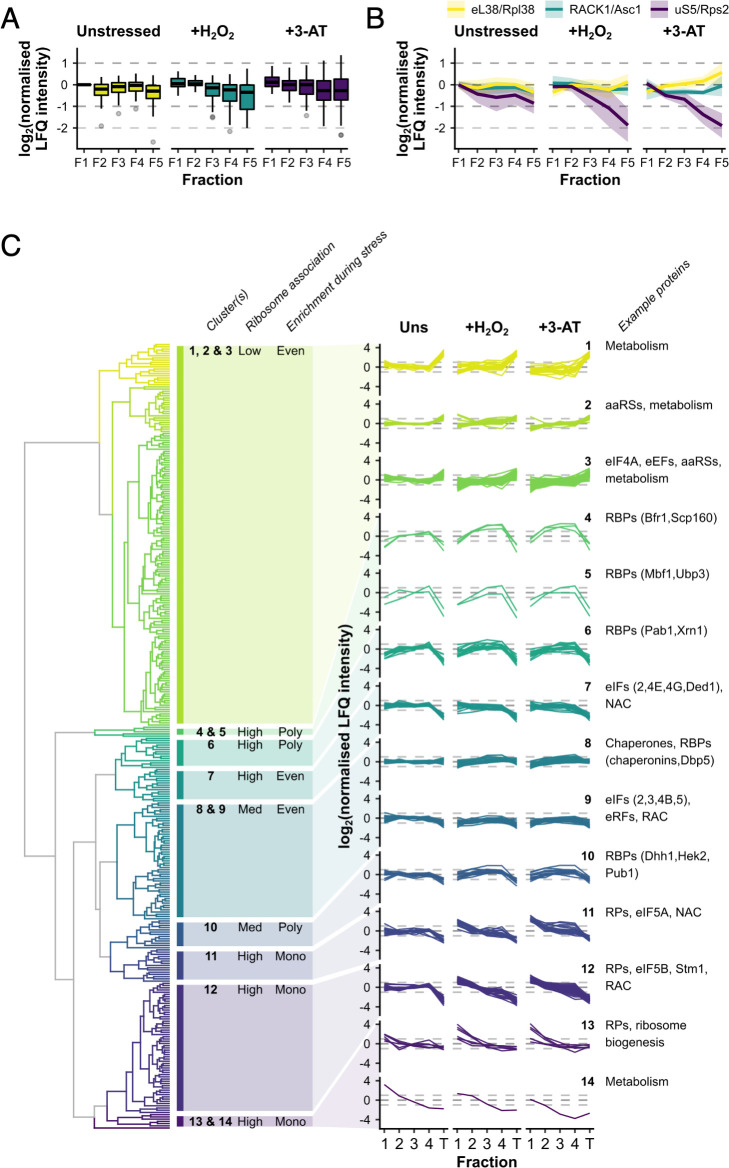
Figure 3. Ribosomal proteins (RPs) and RNA-binding proteins (RBPs) show distinct patterns of polysome enrichment.
(A) The label-free quantification (LFQ) intensities for each RP identified in all conditions F1–F5 were normalised to Rps3/uS3 on a fraction-by-fraction basis and then to unstressed F1. Boxplots showing the distribution of normalised LFQ intensities in each sample. (B) Polysome association profiles for three example RPs normalised to Rps3/uS3. Shaded areas show mean ± standard deviation (SD). (C) Clustered ‘polysome enrichment profiles’ for proteins identified under all three conditions in F1–F4. The LFQ intensities for each protein were normalised only to its own mean across the unstressed fractions. T – total. The overall ribosome association and PE during stress for each cluster or group of clusters is indicated: Poly – polysome-enriched, Mono – monosome-enriched, Even – equally enriched in all fractions.


