. 2022 May 27;11:e73466. doi: 10.7554/eLife.73466

Figure 7. Non-catalytic mutants of Aat2 remain polysome associated and do not show heightened stress sensitivity.

(A) Representative polysome profiles from unstressed and hydrogen peroxide (H2O2)-treated cultures. P/M: mean polysome-to-monosome ratio (n = 2–3). (B) Representative western blots of sucrose gradient fractions from mutated Aat2-TAP strains. The positions of the 80S/monosome and polysome fractions are indicated. (C) Quantification of the 80S/monosomal and polysomal proportions of Aat2-TAP for each strain in (B). The monosomal percentage is indicated. (D) Top: representative western blots showing eIF2α phosphorylation in unstressed and H2O2-treated cultures. Bottom: bands were quantified using LI-COR Image Studio and the eIF2α-P/eIF2α ratio was calculated. Error bars show standard deviation (SD; n = 3–4). (E) β-Galactosidase activity in strains transformed with GCN4-lacZ reporter plasmids (n = 3). Error bars show SD. U – unstressed, H – +0.45 mM H2O2. The t-test was used for comparisons in (D) and (E): ns – not significant (p > 0.05), *p < 0.05, ***p < 0.001. In (D), each t-test result refers to the comparison with the equivalent condition in the parent strain.

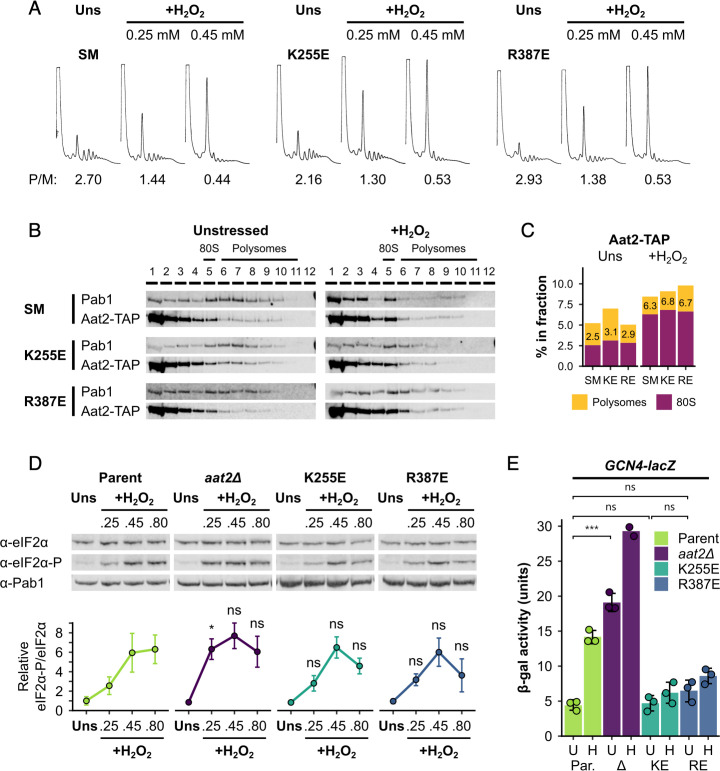
Figure 7.

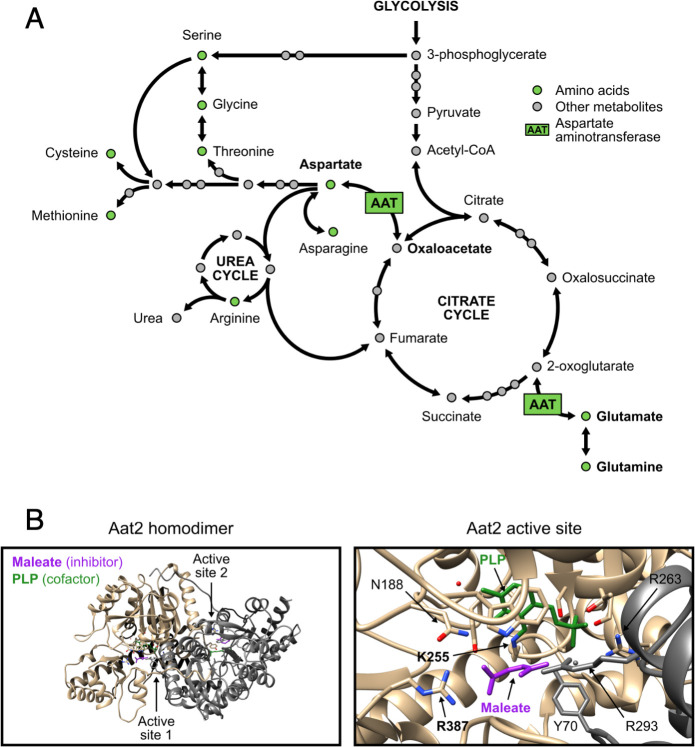
Figure 7—figure supplement 1. Non-catalytic AAT2 mutants are auxotrophic for aspartate and well expressed.

Figure 7—figure supplement 1.

(A) The role of aspartate aminotransferase (AAT) in linking the citrate cycle with amino acid biosynthesis. Both AAT1 and AAT2 encode AAT in Saccharomyces cerevisiae. Its substrates are in bold. Other pathways are available for the interconversion of 2-oxoglutarate and glutamate. Adapted from pathway sce00250 (alanine, aspartate, and glutamate metabolism – S. cerevisiae) in the KEGG database (Ogata et al., 1999). For clarity, some links are not shown. (B) Views of the Aat2 homodimer (left) and active site (right), showing the cofactor pyridoxal-5′-phosphate (PLP, green) and the competitive inhibitor maleate (purple; PDB 1YAA Jeffery et al., 1998). The two active site residues targeted by site-directed mutagenesis are in bold.
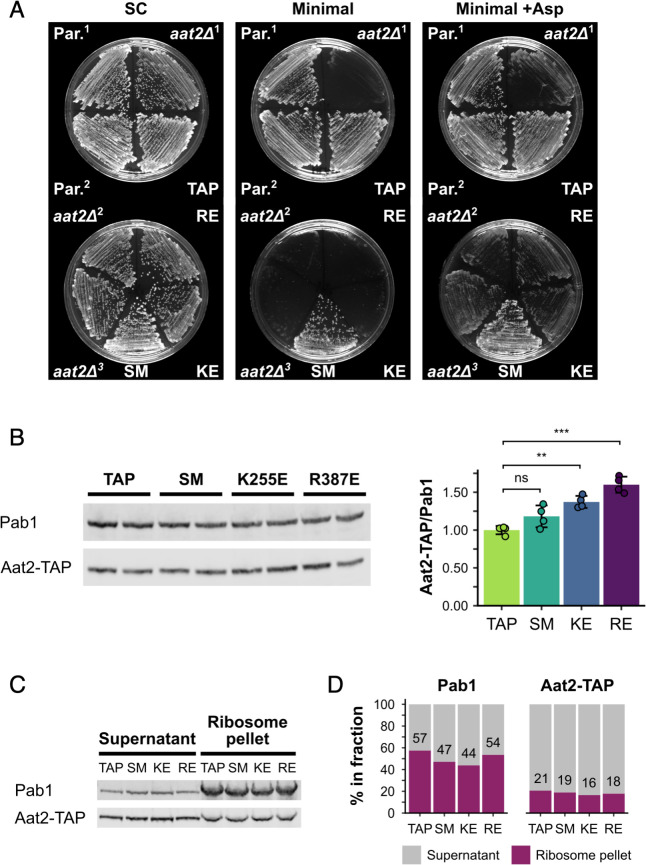
Figure 7—figure supplement 2. Non-catalytic AAT2 mutants are auxotrophic for aspartate, well expressed and co-migrate with ribosomes.

Figure 7—figure supplement 2.

(A) Growth at 30°C on SC, minimal medium and minimal medium supplemented with L-aspartate (+Asp). (B) Left: representative western blot of cell extracts from parent and mutant strains. Right: quantification of Aat2-TAP expression relative to Pab1 (n = 4). Error bars show standard deviation (SD). The t-test was used to compare the strains: ns – not significant (p > 0.05), **p < 0.01, ***p < 0.001. (C) Ribosome pellets were separated from supernatants using sucrose cushions and analysed by western blotting. (D) Bands from (C) were quantified using LI-COR Image Studio and the percentage of signal from each of the two fractions was calculated. Values are indicated for the ribosome pellet fraction. Strains: Par.1 – BY4741 parent strain, Par.2 – parent strain containing HIS3, aat2Δ1 – deletion strain from lab. collection, aat2Δ2 and aat2Δ3 – CRISPR/Cas9 deletions generated from Par.1 and Par.2, respectively, TAP – Aat2-TAP from lab. collection, SM – control Aat2-TAP strain with silent mutations, KE/K255E – Aat2K255E-TAP, RE/R387E – Aat2R387E-TAP.
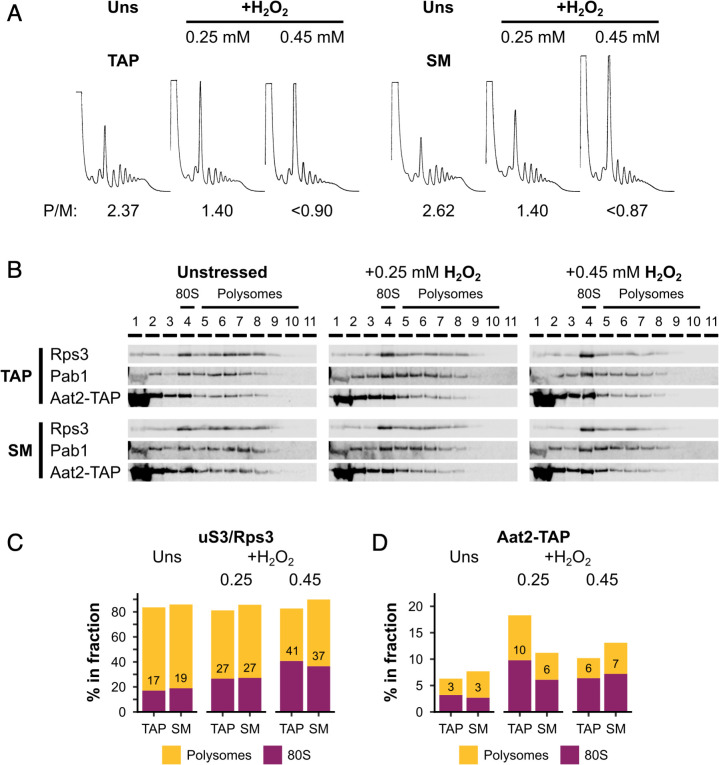
Figure 7—figure supplement 3. Silent mutations do not affect oxidative stress sensitivity or Aat2 polysome association.

Figure 7—figure supplement 3.

(A) Polysome profiles from unstressed and hydrogen peroxide (H2O2)-treated cultures of the Aat2-TAP parent strain (WT) and Aat2-TAP strain with silent mutations (SM). P/M – polysome-to-monosome ratio. (B) Western blots of sucrose gradient fractions from extracts of the WT and SM strains. The positions of the 80S/monosomes and polysomes are indicated. (C) Quantification of the 80S/monosomal and polysomal proportions of uS3/Rps3 and Aat2-TAP in the two strains under each condition. The monosomal percentage is indicated.