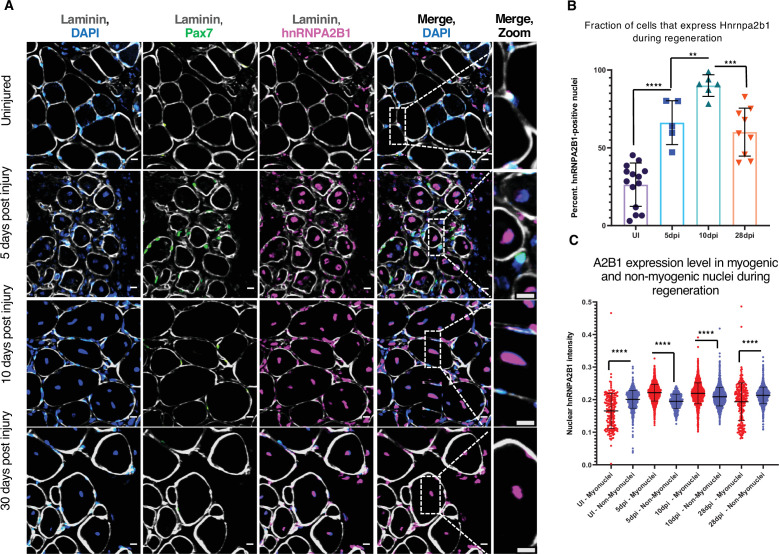
Figure 3. Hnrnpa2b1 is upregulated in myogenic nuclei during skeletal muscle regeneration.
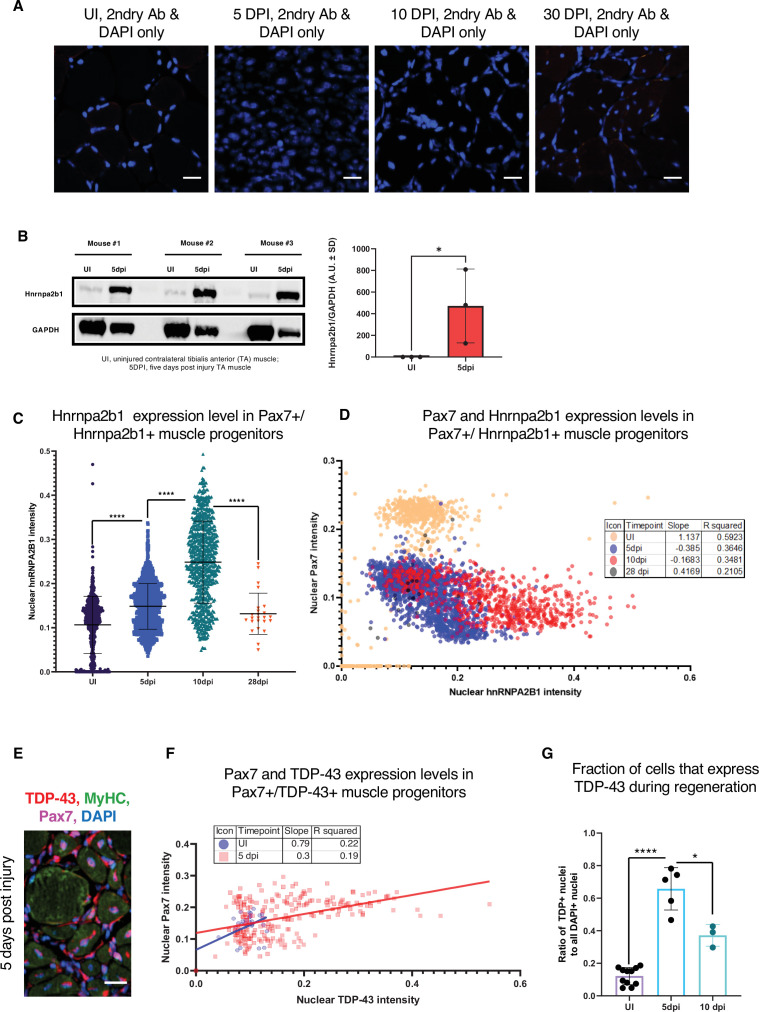
(A) Hnrnpa2b1 immunoreactivity in uninjured (UI), 5, 10, and 30 days post injury (dpi) regenerating mouse muscle. All images represent n = 3 biological replicates; scale = 20 µM. (B) Nuclear Hnrnpa2b1 immunoreactivity in UI, 5, 10, and 28 dpi regenerating muscle. (C) Nuclear Hnrnpa2b1 immunoreactivity intensity in either myonuclei or non-myonuclei in UI, 5, 10, and 28 dpi regenerating muscle. See also Figure 3—figure supplement 1.


