. 2022 May 26;11:e74687. doi: 10.7554/eLife.74687

Figure 1. CTNIPs are a novel family of plant signalling peptide.

(a) Heat map showing log2(FC) expression levels of CTNIP1–4 in response to a range of elicitors (data obtained from Bjornson et al., 2021). CTNIP5 was excluded as it is unannotated in the TAIR10 annotation, which was used to map the RNA sequencing reads. (b) Sequence probability logo from Arabidopsis CTNIP1–4 generated using WebLogo3. Signal peptide (as predicted by SignalP5.0) and CTNIP motif are indicated, and conserved cysteine residues are highlighted in yellow. Amino acids are coloured based on their biochemical properties: red = acidic; blue = basic; black = hydrophobic, and green = polar. (c–d) Cytoplasmic calcium influx measured in p35S::AEQUORIN seedlings after treatment with 1 μM CTNIP relative to pre-treated levels (n = 8 seedlings). (c) Points represent mean; error bars represent SEM. (d) Represents mean relative Ca2+ influx between 5 and 15 min. A line represents mean; error bars represent SD. p-Values indicate significance relative to the wild-type (WT) control in a Dunnett’s multiple comparison test following one-way ANOVA. (e) Western blot using α-p42/p44-ERK recognising phosphorylated MAP kinases in seedlings treated with 100 nM CTNIPs or mock for 15 min. The membrane was stained with CBB, as a loading control. (f–g) ROS production in leaf disks collected from 4-week-old Arabidopsis plants induced by 1 μM CTNIP4 application (n ≥8). (f) Points represent mean; error bars represent SEM. (g) Integrated ROS production over 40 min. Line represents mean; error bars represent SD. p-Values indicate significance relative to the WT control in a two-tailed t-test. All experiments were repeated and analysed three times with similar results. ROS, reactive oxygen species; CBB, Coomassie brilliant blue.

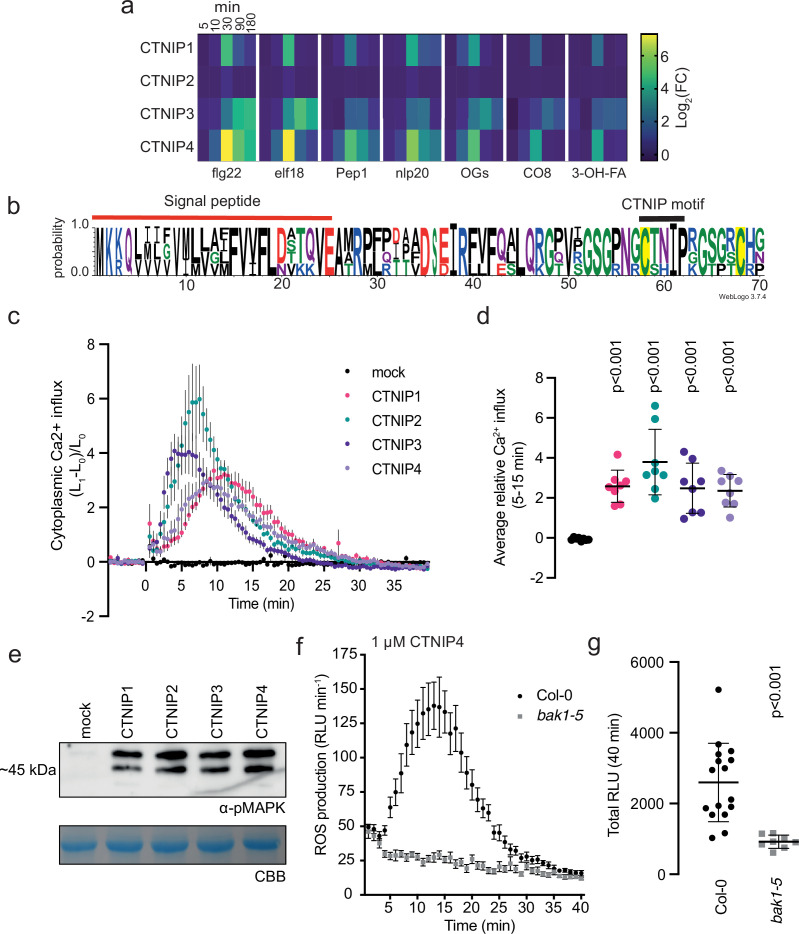
Figure 1—source data 1. CTNIPs are a novel family of plant signalling peptide.
Figure 1—source data 2. CTNIP-induced MAPK phosphorylation.

Figure 1.

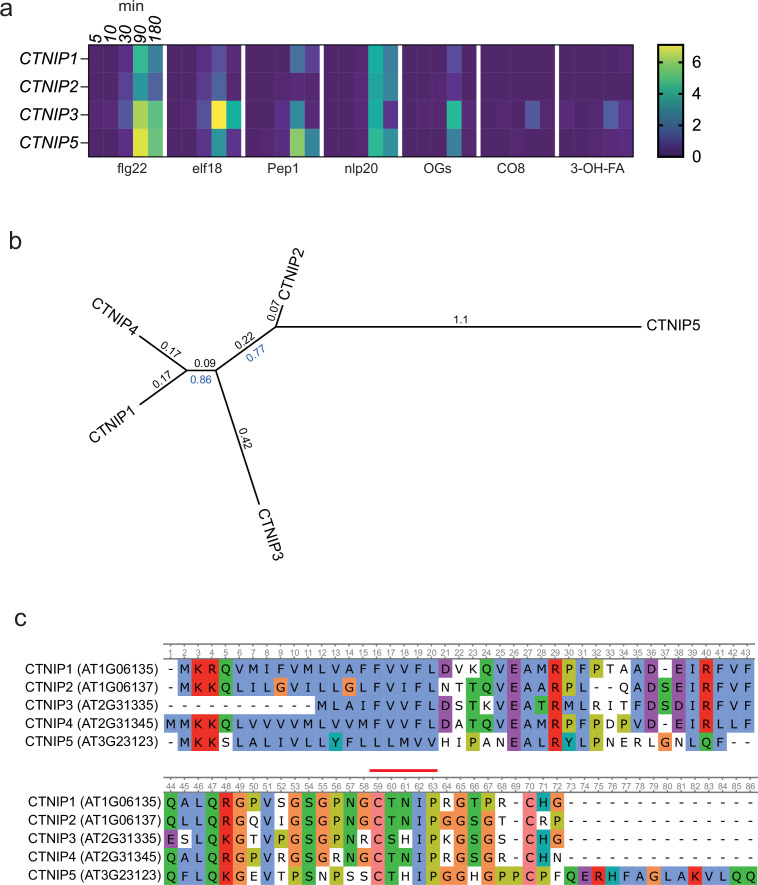
Figure 1—figure supplement 1. Alignment and phylogeny of Arabidopsis CTNIPs.

Figure 1—figure supplement 1.

(a) Expression heat map showing log2(FC) expression levels of CTNIP1, CTNIP2, CTNIP3, and CTNIP5 taken from ArrayExpress which mapped to the Araport11 annotation (Athar et al., 2019; Bjornson et al., 2021). CTNIP4 overlaps with the adjacent transcript AT2G31340 in the Araport11 annotation. Thus, no reads mapped uniquely to CTNIP4 and consequently no differential expression data could be obtained. (b) Phylogeny of Arabidopsis CTNIPs. Full-length protein sequences were aligned using MUSCLE and a phylogeny was inferred using the maximum-likelihood method and JTT matrix-based model conducted in MEGAX. 1000 bootstraps were performed and values shown in blue. Branch lengths are shown in black. (c) Alignment used to generate (b). CTNIP motif is highlighted in red.
Figure 1—figure supplement 1—source data 1. Expression levels of CTNIP1, CTNIP2, CTNIP3, and CTNIP5.

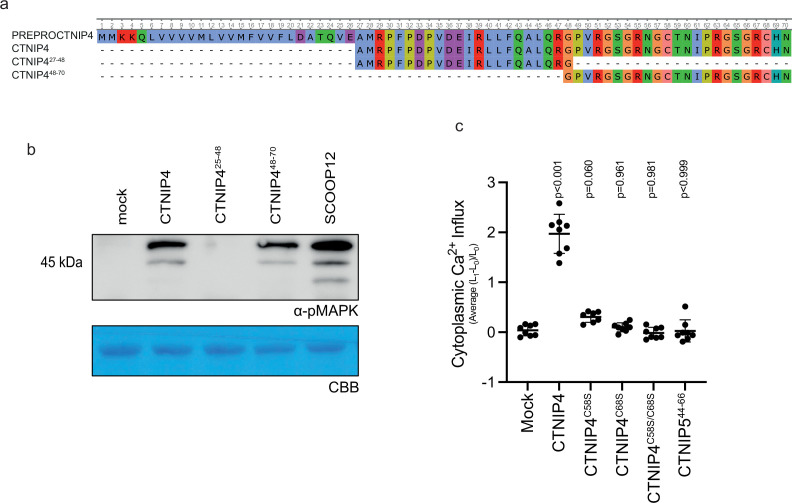
Figure 1—figure supplement 2. Characterisation of CTNIP synthetic peptides.

Figure 1—figure supplement 2.

(a) Alignment of CTNIP4 peptide sequences used in this manuscript. (b) Western blot using α-p42/p44-ERK recognising phosphorylated MAP kinases in seedlings treated with 100 nM CTNIP4 fragments or mock for 15 min. The membrane was stained with Coomassie brilliant blue (CBB), as a loading control. (c) Mean relative Ca2+ influx induced by 1 μM CTNIP in p35S::AEQUORIN seedlings between 5 and 15 min, relative to pre-treatment (n = 8 seedlings). A line represents mean; error bars represent SD. p-Values indicate significance relative to the wild-type (WT) control in a Dunnett’s multiple comparison test following one-way ANOVA.
Figure 1—figure supplement 2—source data 1. CTNIP-induced calcium influx.
Figure 1—figure supplement 2—source data 2. CTNIP-induced MAPK phosophorylation.