. 2022 May 26;11:e74687. doi: 10.7554/eLife.74687

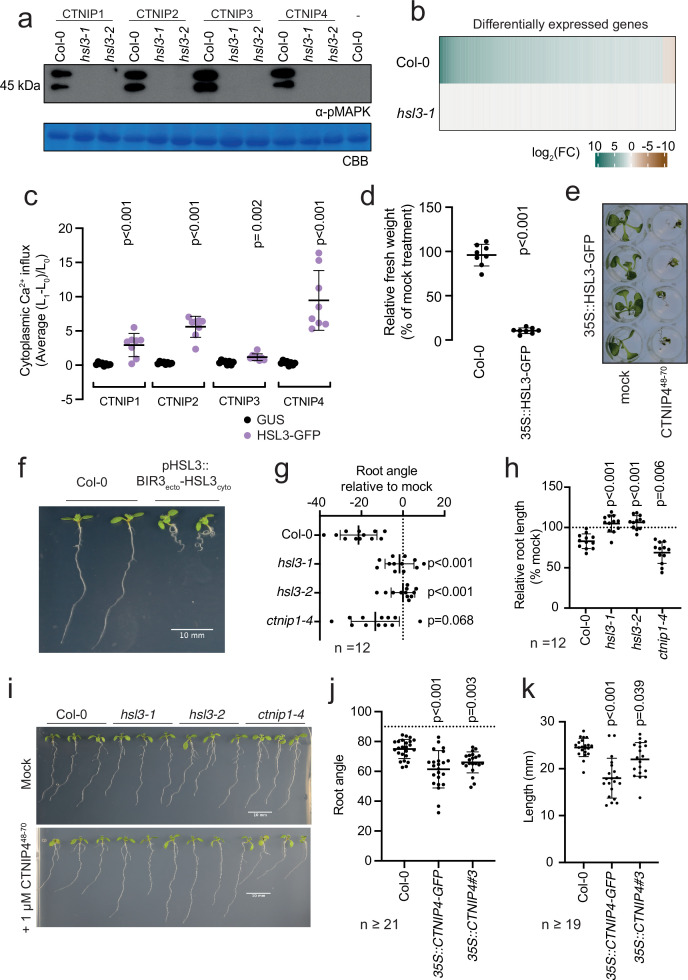
Figure 3. HAESA-LIKE 3 (HSL3) is strictly required for CTNIP perception and growth regulation.

(a) Western blot using α-p42/p44-ERK recognising phosphorylated MAP kinases in seedlings treated with 100 nM CTNIPs or mock for 15 min. The membrane was stained with Coomassie brilliant blue (CBB), as a loading control. (b) Heat map showing all significantly differentially expressed genes (p<0.05, |log2(FC)|>1) in Arabidopsis wild-type (WT) or hsl3-1 seedlings treated with or without 100 nM CTNIP448-70 for 30 min relative to a mock control. (c) Mean relative cytoplasmic Ca2+ influx in leaf disks of Nicotiana benthamiana transiently expressing the defined constructs induced by 1 μM CTNIP or mock application (n = 8 leaf disks). A line represents mean; error bars represent SD. p-Values indicate significance relative to the GUS-transformed control in a Dunnett’s multiple comparison test following one-way ANOVA. (d) Fresh weight of 14-day-old seedlings grown in the presence of 500 nM CTNIP448-70 for 10 days relative to mock (n = 8 seedlings). A line represents mean; error bars represent SD. p-Values indicate significance relative to the WT control in a two-tailed t-test. (e) Representative images of (d). (f,i) Nine-day-old vertically grown Arabidopsis seedlings on 1/2 Murashige and Skoog (MS) agar medium with 1% sucrose. Pictures were taken from the front of the plate. (g–h,j–k) Root parameters were quantified from the base of the hypocotyl to the root tip using ImageJ. (g) Root angle is shown relative to mock. Negative values indicate leftward root skewing. (j) Absolute root angle with 90° representing the gravity vector. Angles < 90° represent skewing to the left. A line represents mean; error bars represent SD. p-Values indicate significance relative to the WT control in a Dunnett’s multiple comparison test following one-way ANOVA. All experiments were repeated and analysed three times with similar results.

Figure 3—source data 1. HSL3 is strictly required for CTNIP perception and growth regulation.
Figure 3—source data 2. HSL3-dependency of CTNIP-induced MAPK phosphorylation.

Figure 3.

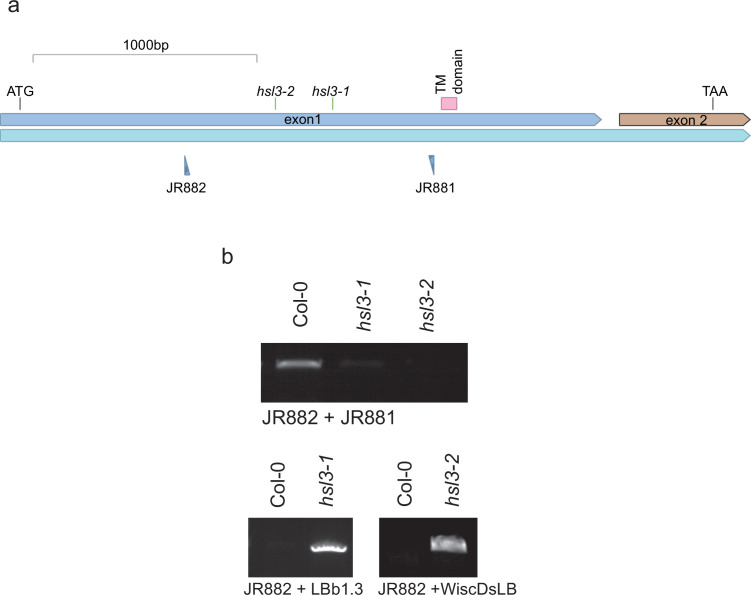
Figure 3—figure supplement 1. Genetic characterisation of hsl3 mutants.

Figure 3—figure supplement 1.

(a) Gene model showing the location of T-DNA inserts. (b) PCR confirming T-DNA insertion and mutant homozygosity.
Figure 3—figure supplement 1—source data 1. Genetic characterisation of hsl3 mutants.

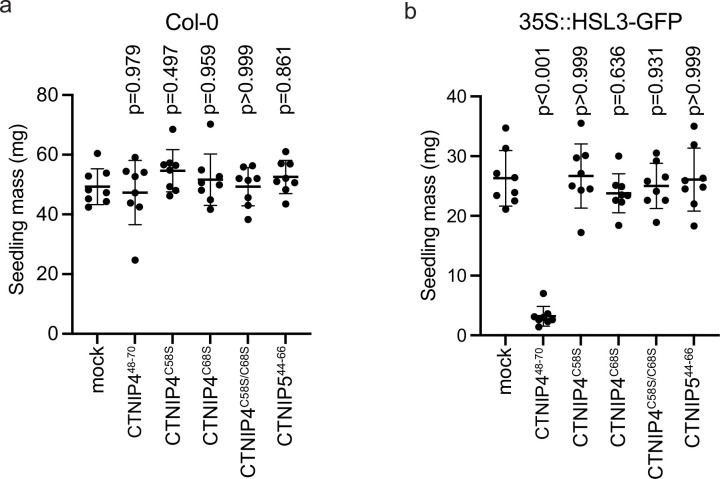
Figure 3—figure supplement 2. CTNIP-induced seedling growth inhibition.

Figure 3—figure supplement 2.

(a–b) Fresh weight of 14-day-old seedlings grown in the presence of 500 nM CTNIPs for 10 days relative to mock (n = 8 seedlings). A line represents mean; error bars represent SD. p-Values indicate significance relative to the wild-type (WT) control in a Dunnett’s multiple comparison test following one-way ANOVA.
Figure 3—figure supplement 2—source data 1. CTNIP-induced seedling growth inhibition.

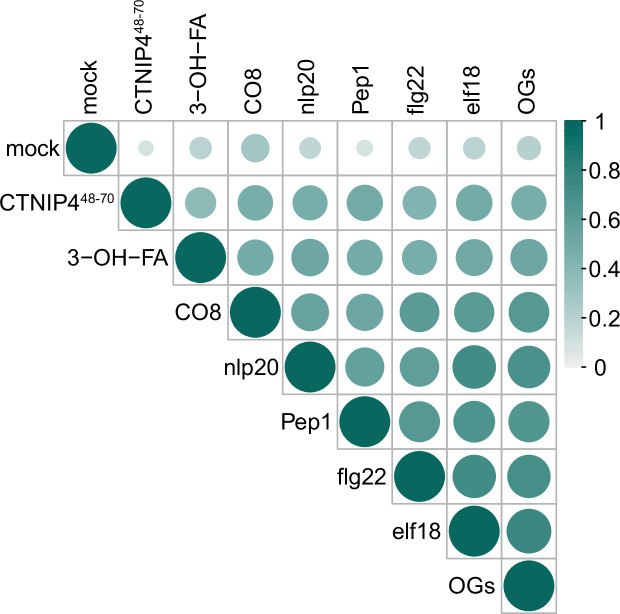
Figure 3—figure supplement 3. Correlation of CTNIP4-induced transcriptomic response with that of elicitors at 30min.

Figure 3—figure supplement 3.

CTINP4-induced gene expression is well correlated with elicitor-induced gene expression from Bjornson et al., 2021. Circle colour and size are proportional to the Spearman correlation coefficient (R-squared value) of each pairwise comparison of log2(fold changes).
Figure 3—figure supplement 3—source data 1. Correlation of CTNIP4-induced transcriptomic response with that of elicitors at 30min.

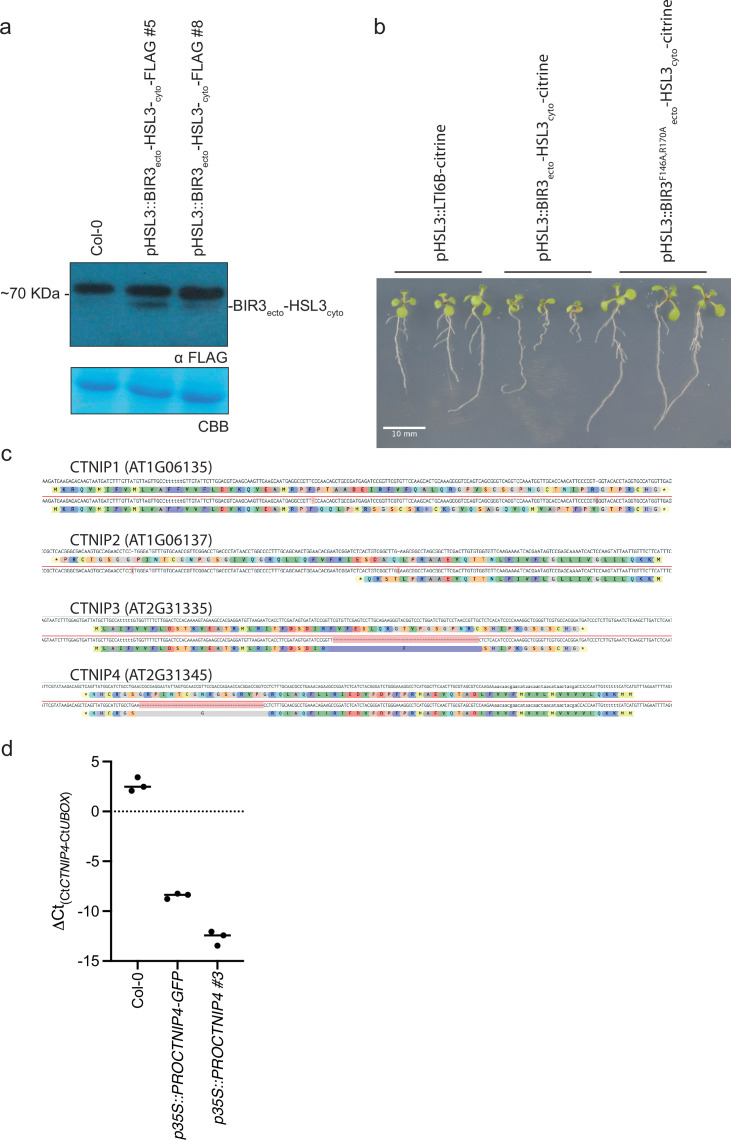
Figure 3—figure supplement 4. Characterisation of CTNIP and chimeric receptor lines.

Figure 3—figure supplement 4.

(a) Western blot using α-FLAG recognising BIR3ecto-HSL3cyto-FLAG in seedlings to confirm expression. The membrane was stained with Coomassie brilliant blue (CBB), as a loading control. (b) Ten-day-old vertically grown Arabidopsis seedlings on 1/2 Murashige and Skoog (MS) agar medium with 1% sucrose. Pictures were taken from the front of the plate. All seedlings are T1 transgenics and were initially selected upon plates containing glufosinate-ammonium and carbenicillin plates for 5 days before being transferred to fresh plates and grown for a further 5 days. (c) Documentation of the Cas9-induced mutations observed within the ctnip1-4 polymutant and their predicted effects on protein products. (d) qRT-PCR documenting the overexpression of CTNIP lines. Expression of CTNIP4 is shown relative to U-Box (At5g15400). Points represent independent biological replicates each comprising two technical replicates. Lines represent the mean of biological replicates.
Figure 3—figure supplement 4—source data 1. Characterisation of CTNIP and chimeric receptor lines.

Figure 3—figure supplement 5. HSL3-CTNIP mutants do not show altered resistance to Pseudomonas syringae pv tomato DC3000 ΔAvrPto/ΔAvrPtoB.
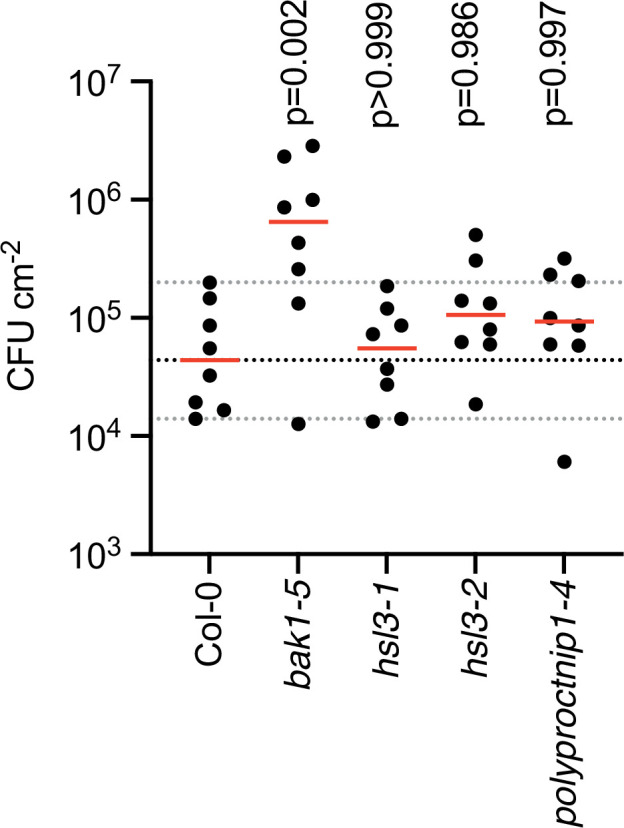
Figure 3—figure supplement 5.

Four-week-old plants were spray inoculated with P. syringae pv tomato DC3000 ΔAvrPto/ΔAvrPtoB (OD600=0.2). Data points represent individual plants (n=8). Red bars represent medians. Dashed lines represent the Col-0 median (black) and 95% confidence intervals of the median (grey). p-Values indicate significance relative to the wild-type (WT) control in a Dunnett’s multiple comparison test following one-way ANOVA.
Figure 3—figure supplement 5—source data 1. HSL3-CTNIP mutants do not show altered resistance to Pseudomonas syringae pv tomato DC3000 ΔAvrPto/ΔAvrPtoB.