. 2022 May 19;11:e76014. doi: 10.7554/eLife.76014

Figure 2. Germ cell subcluster analysis reveals developmental transitions of early germ cells.

(A) Germ cell subcluster uniform manifold approximation and projection (UMAP) plot, with cells color-coded by computationally determined cell subtypes. (B) Dot plot showing the relative expression of select genes in the germ cell subclusters. Some genes, like ddx4 and piwil1, are expressed in all germ cells, while others, such as nanos2 or rec8a, are only expressed in distinct subclusters. (C) Gene expression UMAP plots of select genes. (D–H) Triple hybridization chain reaction RNA fluorescent in situ hybridization (HCR RNA-FISH) for nanos2 (green), foxl2l (magenta), and rec8a (blue) in 40-day-old zebrafish whole-mount ovary. Asterisk in (F) indicates a cell double-positive for nanos2 and foxl2l. (I) Cell number quantification of individual cysts that express the genes indicated on Y-axis. n = 70, N = 3. Scale bar in (F), for (D–G) 10 µm; in (H) 10 µm.

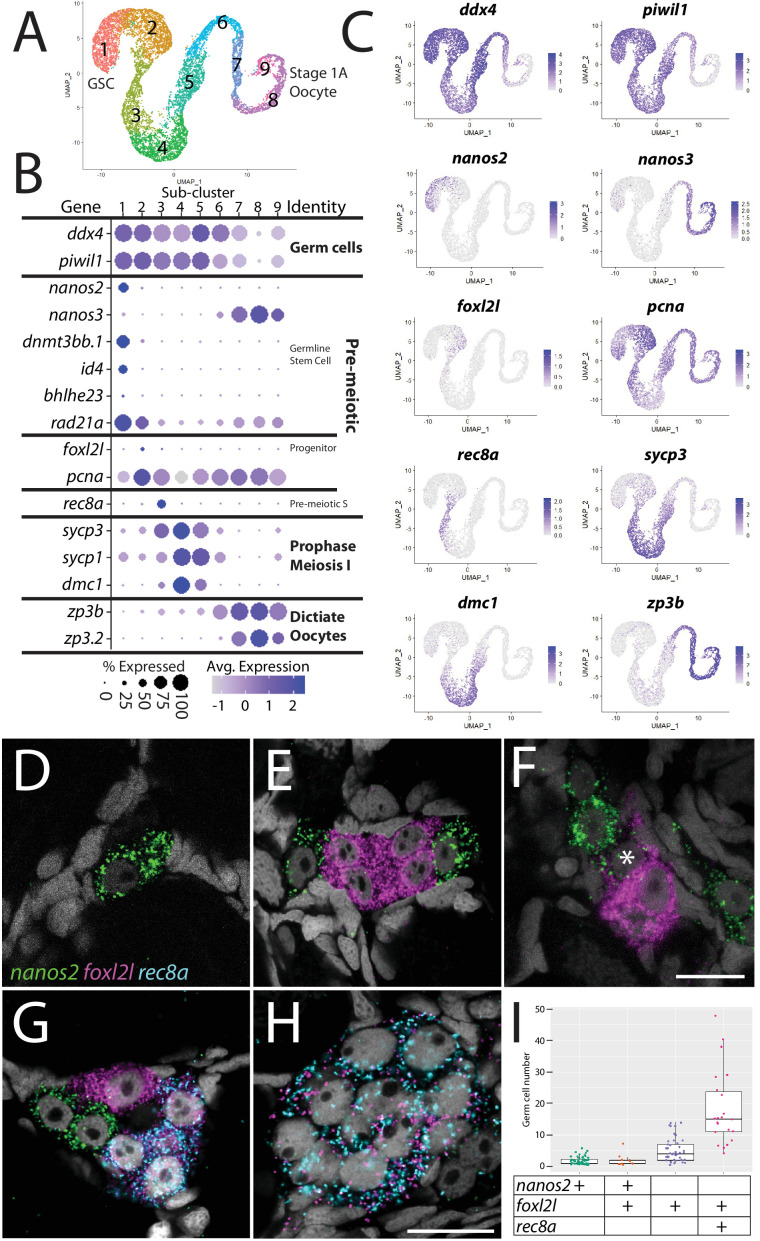
Figure 2.

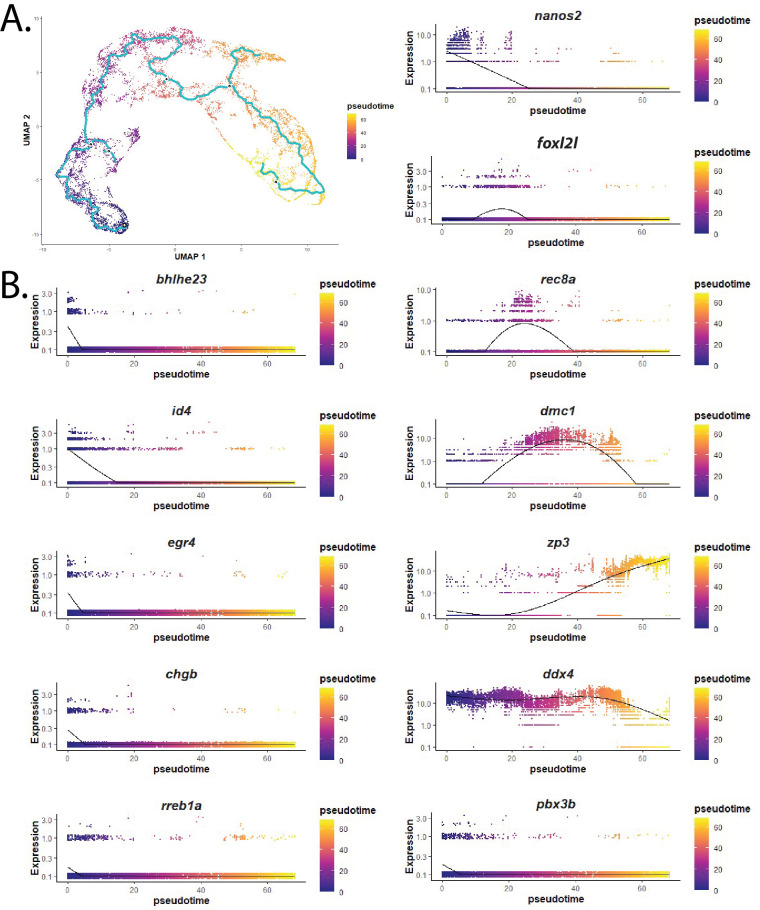
Figure 2—figure supplement 1. Developmental trajectory analysis of the germ cell library using Monocle 3 produced a similar trajectory to that apparent in the SURAT-based cluster analysis.

Figure 2—figure supplement 1.

(A) Germ cell subcluster trajectory uniform manifold approximation and projection (UMAP) plot from Monocle 3. (B) Pseudotime gene expression plots from Monocle 3 for several germ cell-relevant genes (see text for details).
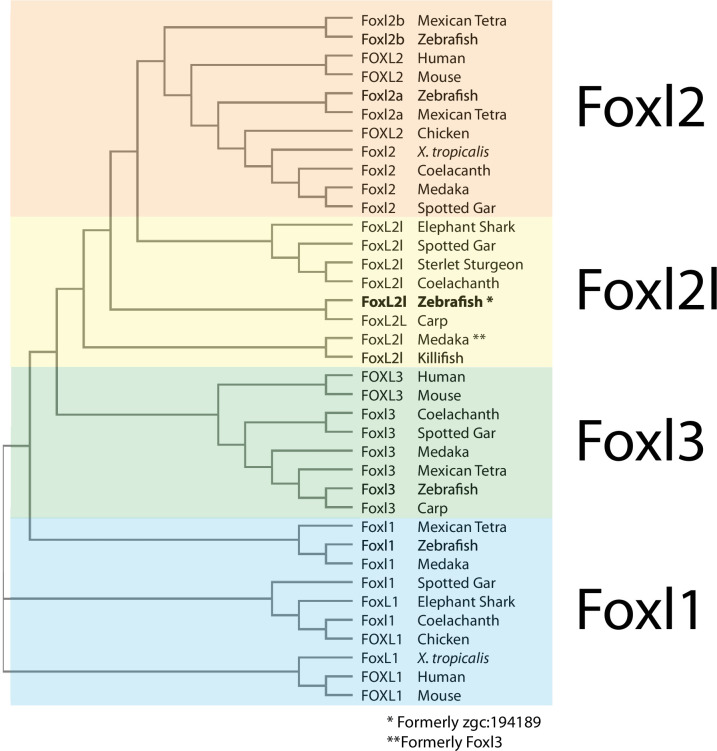
Figure 2—figure supplement 2. Phylogenetic analysis of Foxl2, Foxl2l, Foxl3, and Foxl1 proteins.

Figure 2—figure supplement 2.

* denotes zebrafish Foxl2l (formerly annotated as zgc:194189) and ** denotes medaka Foxl2l (formerly called Foxl3). Accession numbers of genes used in this analysis can be found in Materials and methods.
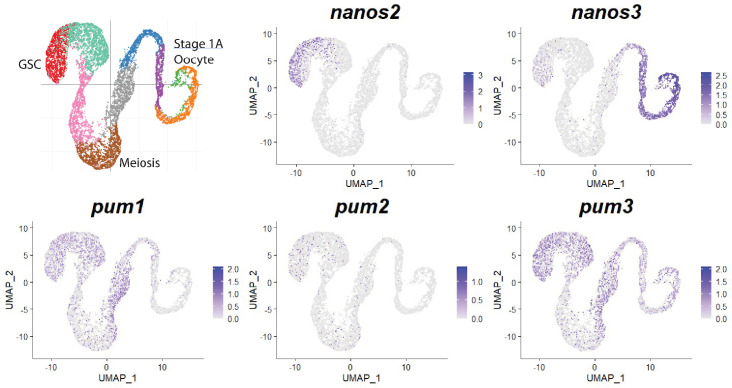
Figure 2—figure supplement 3. Expression of nanos and pumilio orthologs in zebrafish germ cells.

Figure 2—figure supplement 3.

Gene expression uniform manifold approximation and projection (UMAP) plots of select genes. Cells expressing the indicated gene are colored blue, and the relative intensity indicates relative expression levels (intensity scale for each plot is on the right). The UMAP in the upper-left corner shows cells color-coded by computationally determined cell subtypes.
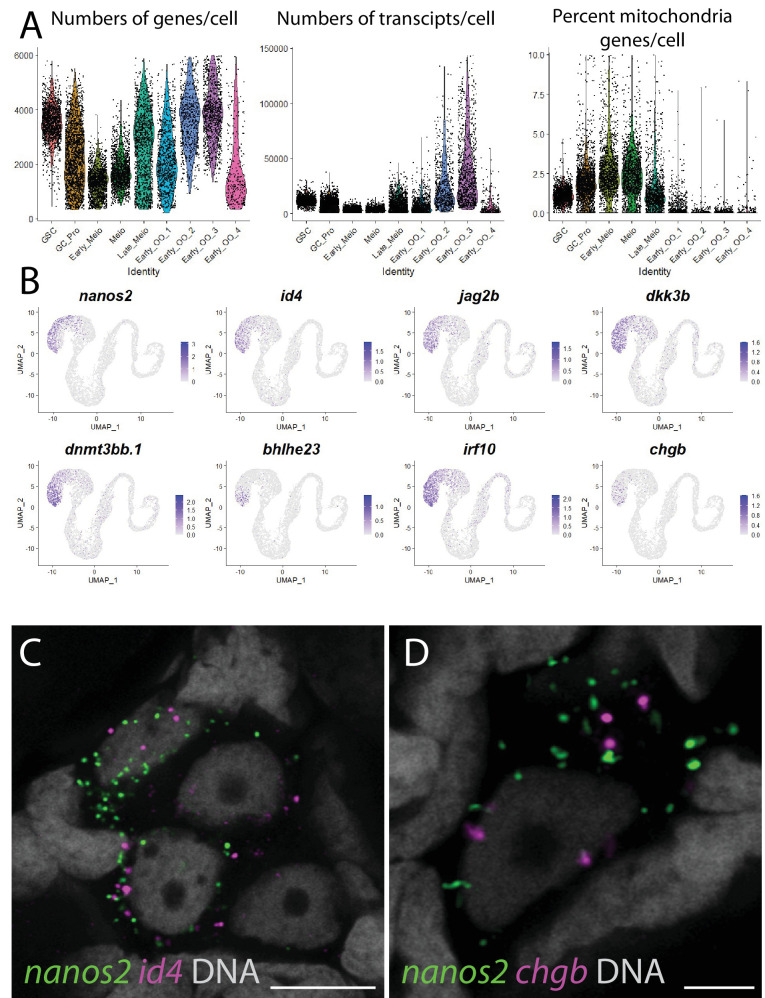
Figure 2—figure supplement 4. Germ cell library statistics and novel zebrafish germline stem cell (GSC) markers.

Figure 2—figure supplement 4.

(A) Violin plot of the number of genes per cell, number of transcripts per cell, and percent of mitochondria genes in each germ cell subclusters. (B) Gene expression UMAP plots of select GSC-enriched genes. Cells expressing the indicated gene are colored blue, and the relative intensity indicates relative expression levels (intensity scale for each plot is on the right). (C, D) Multicolor fluorescent in situ hybridization (mFISH) on whole-mount 40-day post-fertilization (dpf) ovaries reveals the location confirms expression of id4 (red in panel C; n = 18/18 double-positive, four replicates) and chga (red in panel D; n = 4/22 double-positive, four replicates) in nanos2-expressing GSCs (green). In all panels, DNA is gray. 5 µm scale bars.
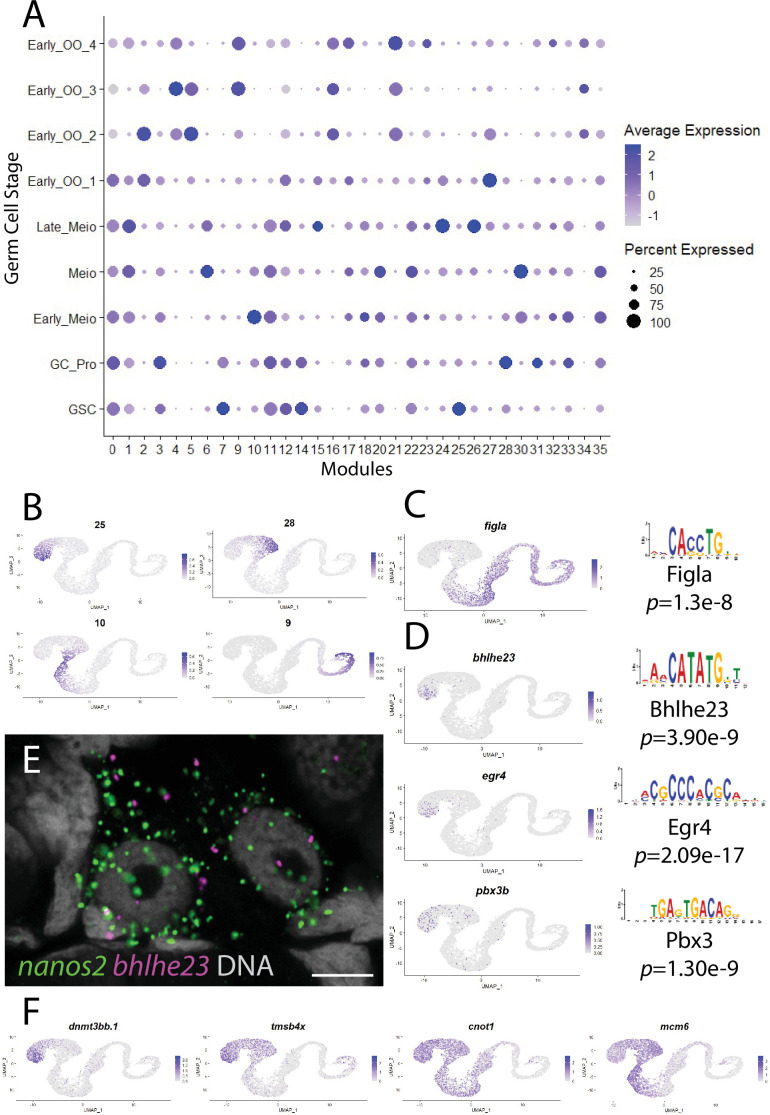
Figure 2—figure supplement 5. Gene module analysis and motif enrichment identify putative germline stem cell (GSC)-specific transcription factors.

Figure 2—figure supplement 5.

(A) Dot plot of expression level and percent expressed of identified gene modules corresponding to germ cell clusters. (B) Average expression of genes in selected gene modules plotted in germ cell subcluster. (C) Gene expression plots and corresponding binding motifs of Figla (module 9). (D) Gene expression plots and GSC-enriched selected transcription factors that were identified from motifs (module 25). (E) Multicolor fluorescent in situ hybridization (mFISH) on whole-mount 40-day post-fertilization (dpf) ovaries confirms expression of bhlhe23 (red) in nanos2-expressing GSC (green). DNA is gray. 5 µm scale bars.