
Fig. 1. Effect of TGFβ2 treatment on f-actin network.
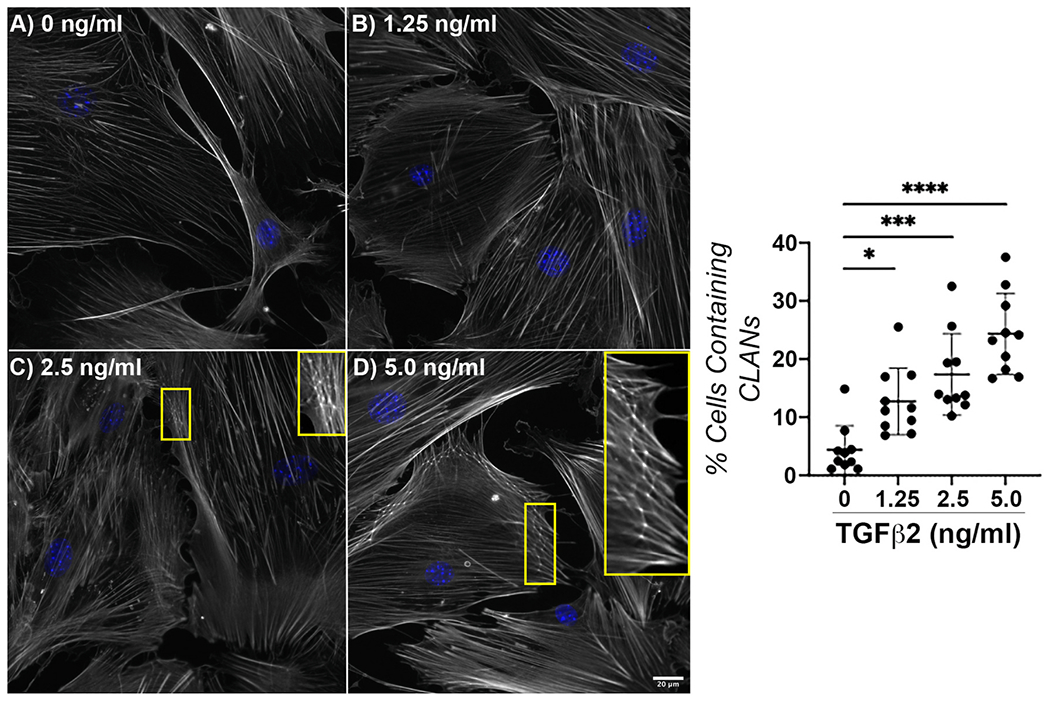
Representative fluorescence images of f-actin within ONH astrocytes following treatment with (A) vehicle control, (B) TGFβ2 (1.25 ng/ml), (C) TGFβ2 (2.5 ng/ml); inset magnified view CLANs, and (D) TGFβ2 (5.0 ng/ml); inset CLANs for 48 h (f-actin = white, DAPI = blue). Scale bar 20 μm. (E) Quantification of percent cells containing CLANs after TGFβ2 treatment for 48 h (vehicle control, 4.38 ± 4.18; 1.25 ng/ml, 12.72 ± 5.78; 2.5 ng/ml, 17.35 ± 7.02; 5.0 ng/ml, 24.35 ± 6.96; *p < 0.05; ***p < 0.001; ****p < 0.0001) N = 10.