Figure 3.

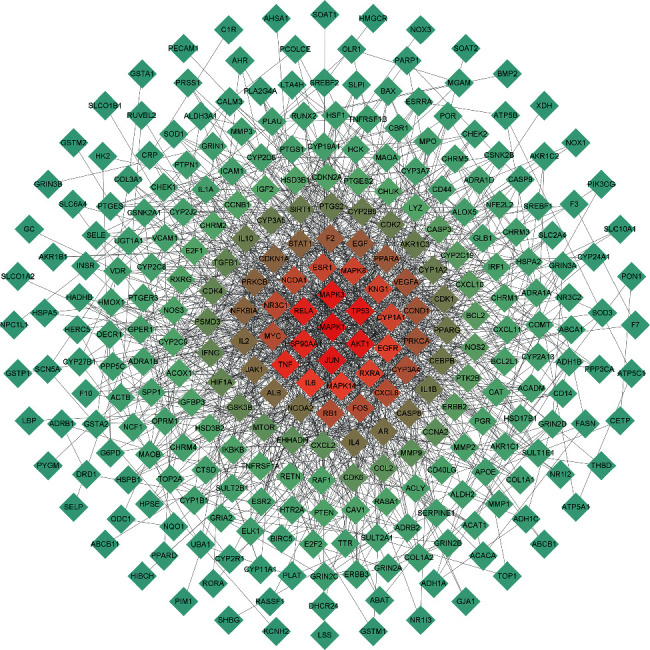
The PPI network of the HSYC's targets. The color of the nodes is illustrated from red to cyan in descending order of degree values.

The PPI network of the HSYC's targets. The color of the nodes is illustrated from red to cyan in descending order of degree values.