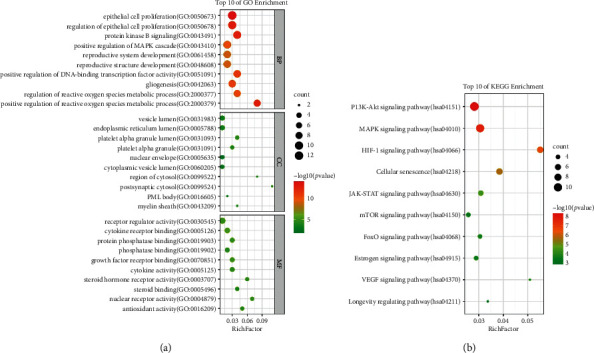
Figure 5.

GO and KEGG enrichment analysis. The top ten significantly enriched terms in GO (biological process (BP), cellular component (CC), and molecular function (MF)) and KEGG enrichment analysis. The Y-axis represents the term, and the X-axis represents the enrichment factor. The bubble size represents the number of genes belonging to the term. The bubble color represents the value of p value.
