
Figure 9.
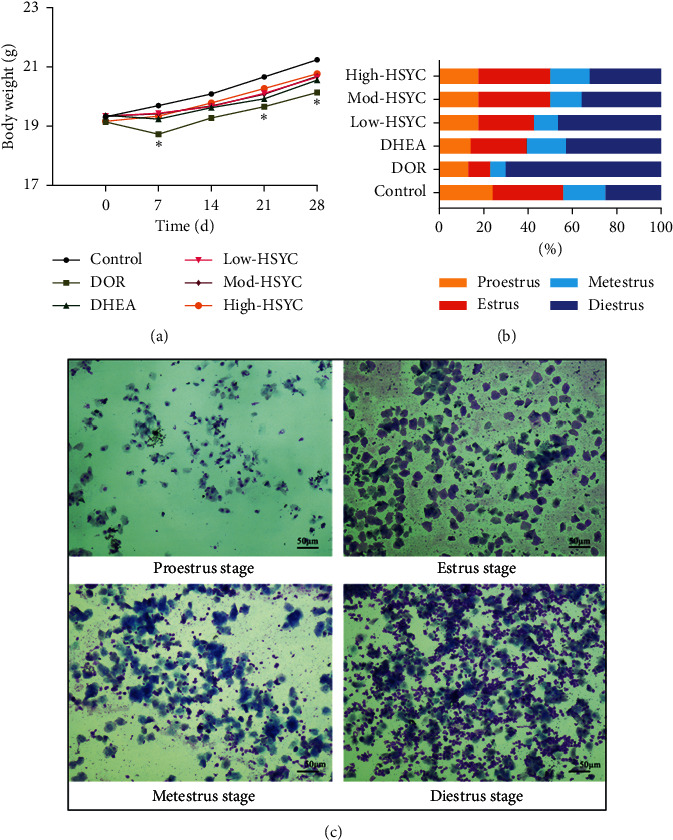
The body weight and the estrus cycle in mice. (a) Body weight changes of mice in each group. Data are expressed as mean ± SD. ∗P < 0.05, compared with the control group. (b) The proportion of time (days) at the four estrous cycle stages of each group within 28 days of drug treatment. (c) The representative staining of vaginal smears indicated the proestrus, estrus, metestrus, and diestrus cycle stages, respectively.