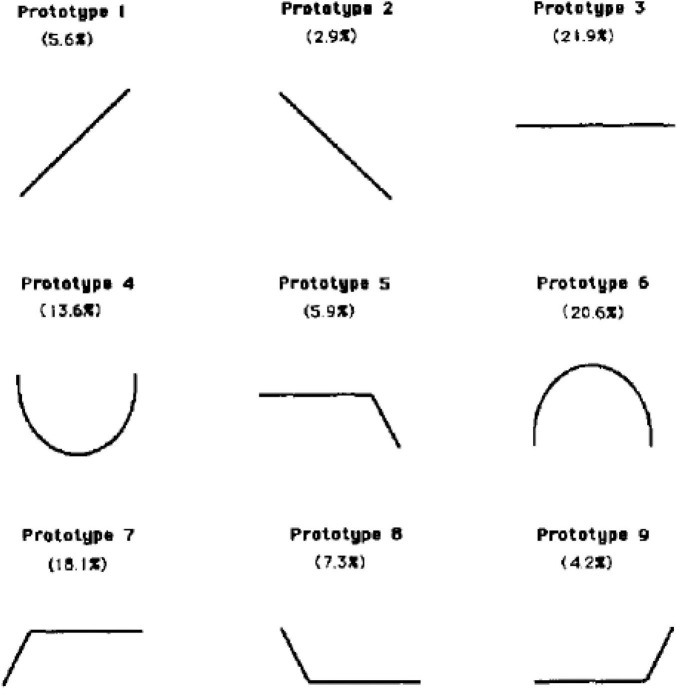
FIGURE 1.
Images representing different implicit theories of developmental change. Image taken from Figure 1 of Ross (1989). Participants saw each line with a description. Patterns referred to here as (in numerical order): increasing, decreasing, flat, U, elderly decline, parabolic, plateau, floor, elderly spike.

