Fig. 2.
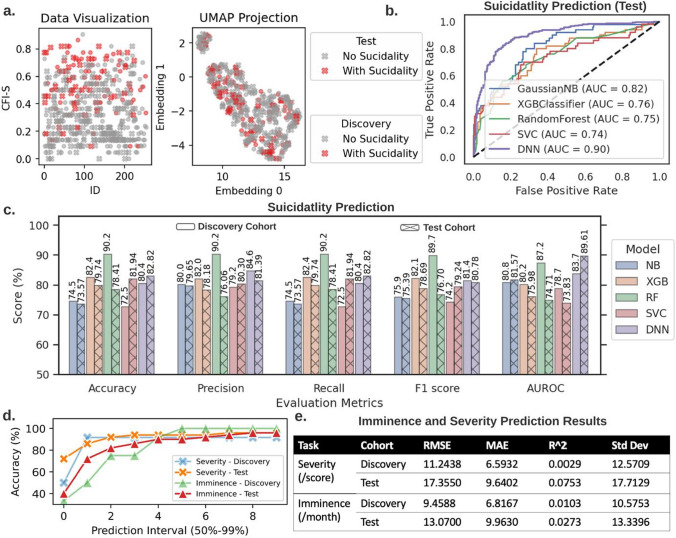
Machine learning analyses. a Visualization of the discovery (255 patients) and the validation (227 patients) cohort in the raw data and the uniform manifold approximation and projection (UMAP) space, respectively. The UMAP projection transforms the high-dimensional data into a 2D visualization and shows that the two suicidality classes (0 and 1) are overlapping by a large margin. This preliminary data inspection demonstrates the difficulty posed to the supervised machine learning tasks. b The receiver operating characteristic (ROC) curve comparison among several classifiers (i.e., naive Bayes (NB), XGBoost (XGB), random forest (RF), support vector machine (SVM), and deep neural network (DNN) classifier) for the suicidality classification. c The accuracy, precision, recall evaluation metrics, F1 score, and area under the receiver operating characteristic (AUROC) for the considered classifiers in the suicidality classification. The RF and DNN classifier emerge as the best model in discovery and test cohorts, respectively. d DNN accuracy increases for larger prediction intervals (PI) for the imminence and severity prediction on the discovery and test cohorts. e Since the imminence prediction and severity prediction represent regression problems, we report several standard evaluation metrics, such as the root mean square error (RMSE), mean average error (MAE), R-squared (R^2), and standard deviation. The usage of the discovery cohort in all experiments is the same as the training set in standard machine learning problems, and the test cohort can be seen as equivalent to the external test set

