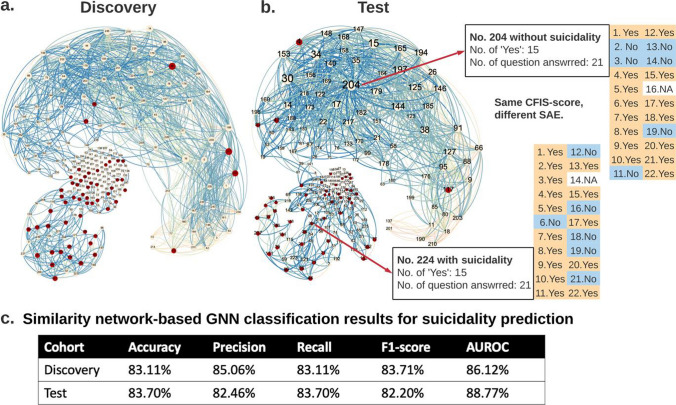
Fig. 3.
Similarity network classifier for visualizing patient’s risk. The discovery cohort (a) and test cohort (b) CFI-S-based similarity networks consist of nodes (patients) and weighted edges capturing the cosine similarity among pairs of patients’ CFI-S records. The edge color depends on the weight value. The node color indicates if a patient has suicidality. This topological representation of the CFI-S’s patients data shows that patients with suicidality (red nodes) are more clustered together towards the lower left part of the networks, while patients without suicidality (yellow nodes) are located mostly in the rest of the network. From the results shown in (c), we can see that similarity network-based GNN provides results that are comparable with DNN model

