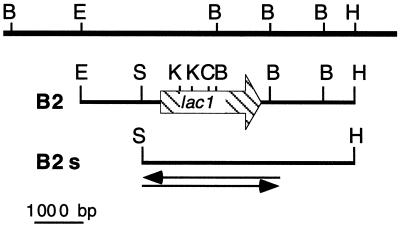
FIG. 3.
Restriction map of the cloned genomic DNA. The top line contains restriction sites deduced from a genomic Southern blot (not shown). The hatched arrow on the second line represents the lac1 open reading frame. The bottom line represents clone B2s; arrows represent the portion of the clone which was sequenced on both strands. Restriction enzymes: B, BamHI; C, ClaI; E, EcoRI; H, HindIII; K, KpnI.

